
Nomenclature
Short Name:
DRAK2
Full Name:
Death-associated protein kinase-related apoptosis inducing protein kinase 2
Alias:
- EC 2.7.11.1
- Serine,threonine kinase 17B
- ST17B
- STK17B
Classification
Type:
Protein-serine/threonine kinase
Group:
CAMK
Family:
DAPK
SubFamily:
NA

Structure
Mol. Mass (Da):
42,344
# Amino Acids:
372
# mRNA Isoforms:
1
mRNA Isoforms:
42,344 Da (372 AA; O94768)
4D Structure:
Interacts with CHP causing CHP to translocate from the Golgi to the nucleus
1D Structure:
3D Image (rendered using PV Viewer):
PDB ID
Subfamily Alignment
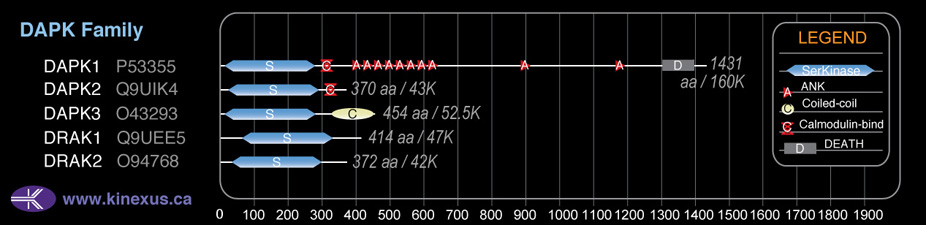
Domain Distribution:
| Start | End | Domain |
|---|---|---|
| 33 | 293 | Pkinase |
Post-translation Modifications
For detailed information on phosphorylation of this kinase go to PhosphoNET
Serine phosphorylated:
S10, S12, S328, S348, S351.
Threonine phosphorylated:
T333.
Ubiquitinated:
K37, K53, K65, K88, K185.
Distribution
Based on gene microarray analysis from the NCBI
Human Tissue Distribution
% Max Expression:
Mean Expression:
Number of Samples:
Standard Deviation:
% Max Expression:
Mean Expression:
Number of Samples:
Standard Deviation:
 62
62
1201
41
1148
 1.1
1.1
22
17
24
 54
54
1035
8
924
 20
20
391
144
1375
 32
32
616
44
564
 47
47
902
108
3050
 9
9
171
51
281
 89
89
1713
46
3736
 21
21
397
17
344
 3
3
64
133
148
 11
11
203
34
473
 39
39
753
179
1125
 100
100
1931
30
5079
 0.9
0.9
18
12
16
 11
11
211
29
425
 2
2
40
25
56
 4
4
86
266
308
 79
79
1524
17
2834
 3
3
53
119
141
 32
32
613
165
628
 12
12
226
27
459
 91
91
1757
30
4472
 90
90
1742
10
2328
 29
29
558
17
925
 89
89
1720
27
3797
 94
94
1824
87
3738
 85
85
1638
32
4340
 48
48
924
17
1804
 17
17
328
17
549
 2
2
37
56
28
 46
46
890
24
759
 73
73
1416
41
5592
 21
21
403
96
525
 47
47
907
104
785
 4
4
79
61
86
Evolution
Species Conservation
PhosphoNET % Identity:
PhosphoNET % Similarity:
Homologene %
Identity:
PhosphoNET % Identity:
PhosphoNET % Similarity:
Homologene %
Identity:
 100
100
100
100 99.5
99.5
100
99.5 83.3
83.3
86.7
94 -
-
-
93 -
-
-
88 95.4
95.4
97.8
95 -
-
-
- 91.4
91.4
95.2
91 91.7
91.7
95.2
92 -
-
-
- -
-
-
- 72.6
72.6
85.5
73 48.7
48.7
66
69 54.3
54.3
72.8
57 -
-
-
- 21.3
21.3
31.4
43 36.8
36.8
54.8
- -
-
-
- 36.5
36.5
51
- -
-
-
- -
-
-
- -
-
-
- -
-
-
- -
-
-
- -
-
-
-
For a wider analysis go to PhosphoNET Evolution in PhosphoNET
Binding Proteins
Examples of known interacting proteins
hiddentext
| No. | Name – UniProt ID |
|---|---|
| 1 | CHP - Q99653 |
Regulation
Activation:
NA
Inhibition:
NA
Synthesis:
NA
Degradation:
NA
Known Upstream Kinases
For further details on these substrates click on the Substrate Short Name or UniProt ID. Phosphosite Location is hyperlinked to PhosphoNET
predictions.
Based on in vitro and/or in vivo phosphorylation data
| Kinase Short Name | UniProt ID (Human) | Phosphosite Location | Phosphosite Sequence | Effect of Phosphorylation |
|---|
Known Downstream Substrates
For further details on these substrates click on the Substrate Short Name or UniProt ID. Phosphosite Location is hyperlinked to PhosphoNET
predictions.
Based on in vitro and/or in vivo phosphorylation data
| Substrate Short Name | UniProt ID (Human) | Phosphosite Location | Phosphosite Sequence | Effect of Phosphorylation |
|---|
| DRAK2 (STK17B) | O94768 | S10 | RRRFDCRSISGLLTT | |
| DRAK2 (STK17B) | O94768 | S12 | RFDCRSISGLLTTTP | |
| DRAK2 (STK17B) | O94768 | S328 | SEDKTSKSSCNGTCG | |
| DRAK2 (STK17B) | O94768 | S348 | ENIPEDSSMVSKRFR | |
| DRAK2 (STK17B) | O94768 | S351 | PEDSSMVSKRFRFDD | |
| DRAK2 (STK17B) | O94768 | T333 | SKSSCNGTCGDREDK |
Protein Kinase Specificity
Matrix of observed frequency (%) of amino acids in aligned protein substrate phosphosites
Matrix Type:
Predicted from the application of the Kinexus Kinase Substrate Predictor Version 2.0 algorithm, which was trained with over 10,000 kinase-protein substrate pairs and 8,000 kinase-peptide substrate pairs.
Domain #:
1
Inhibitors
For further details on these inhibitors click on the Compound Name and enter it into DrugKiNET or click on the ID's
Based on in vitro and/or in vivo phosphorylation data
| Compound Name | KD, Ki or IC50 (nM) | PubChem ID | ChEMBL ID | PubMed ID |
|---|
Disease Linkage
General Disease Association:
Immune disorders
Specific Diseases (Non-cancerous):
Autoimmune suceptibility
Comments:
Defects in DRAK2 function have been implicated in heightened autoimmue reactions. In animal studies, the ectopic expression of DRAK2 in CD4+/CD8+ thymocytes lead to peripheral T-cell hypersensitivity, enhanced suceptibility to experimental autoimmune encephalomyelitis (EAE) (animal model of multiple sclerosis), and displayed spontaneous autoimmunity. In addition, mice deficient in DRAK2 expression were resistant to EAE, indicating defective autoimmune responses. IFurthermore, DRAK2 deficient T-cells were shown to be more suceptible to apoptosis and required greater tonic signalling during development for the maintenance of the T-cell phenotype. The overactive or inappropriate activation of T-cell receptor (TCR) signalling in T-lymphocytes can lead to a variety of autoimmune diseases. Therefore, negative regulation of this signalling pathway is require to enforce immunological self-tolerance and prevent reactivity of T-cells to auto-antigens.
Gene Expression in Cancers:
TranscriptoNET (www.transcriptonet.ca) analysis with mRNA expression data retrieved from the National Center for Biotechnology Information's Gene Expression Omnibus (GEO) database, which was normalized against 60 abundantly and commonly found proteins, indicated altered expression for this protein kinase as shown here as the percent change from normal tissue controls (%CFC) as supported with the Student T-test in the following types of human cancers: Brain glioblastomas (%CFC= -66, p<0.103); Clear cell renal cell carcinomas (cRCC) stage I (%CFC= +438, p<0.039); and Colon mucosal cell adenomas (%CFC= -46, p<0.0006). The COSMIC website notes an up-regulated expression score for DRAK2 in diverse human cancers of 291, which is 0.6-fold of the average score of 462 for the human protein kinases. The down-regulated expression score of 2 for this protein kinase in human cancers was 97% lower than the average score of 60 for the human protein kinases.
Mutagenesis Experiments:
Insertional mutagenesis studies in mice have not yet revealed a role for this protein kinase in mouse cancer oncogenesis.
Mutation Rate in All Cancers:
Percent mutation rates per 100 amino acids length in human cancers: 0.07 % in 25464 diverse cancer specimens. This rate is only -10 % lower and is very similar to the average rate of 0.075 % calculated for human protein kinases in general.
Mutation Rate in Specific Cancers:
Highest percent mutation rates per 100 amino acids length in human cancers: 0.28 % in 1270 large intestine cancers tested; 0.27 % in 589 stomach cancers tested.
Frequency of Mutated Sites:
None > 4 in 20,009 cancer specimens
Comments:
Only 4 deletions, no insertions or complex mutations.