
Nomenclature
Short Name:
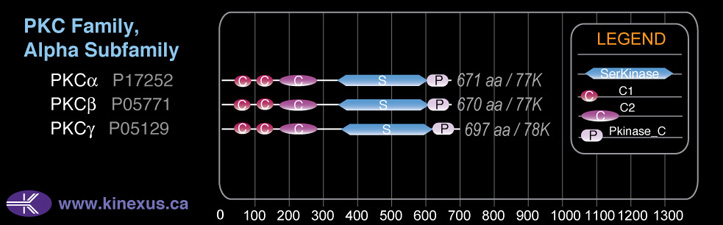
PKCg
Full Name:
Protein kinase C, gamma type
Alias:
- EC 2.7.11.13
- PKCC
- PKC-gamma
- PKC-I
- PRKCG
- SCA14
- Kinase PKC-gamma
- KPCG
- MGC57564
- PKC I
Classification
Type:
Protein-serine/threonine kinase
Group:
AGC
Family:
PKC
SubFamily:
Alpha

Specific Links
Structure
Mol. Mass (Da):
78,448
# Amino Acids:
697
# mRNA Isoforms:
2
mRNA Isoforms:
78,448 Da (697 AA; P05129); 62,030 Da (548 AA; P05129-2)
4D Structure:
Interacts with CDCP1
1D Structure:
Subfamily Alignment
Domain Distribution:
Kinexus Products
Click on entries below for direct links to relevant products from Kinexus for this protein kinase.
hiddentext
Post-translation Modifications
For detailed information on phosphorylation of this kinase go to PhosphoNET
Acetylated:
K197 (N6).
Serine phosphorylated:
S70, S145, S148, S320.
Threonine phosphorylated:
T82, T155, T510+, T511+, T512+, T514+, T518-, T655+, T674+.
Tyrosine phosphorylated:
Y195, Y521-, Y529.
Distribution
Based on gene microarray analysis from the NCBI
Human Tissue Distribution
% Max Expression:
Mean Expression:
Number of Samples:
Standard Deviation:
% Max Expression:
Mean Expression:
Number of Samples:
Standard Deviation:
 63
63
850
22
1112
 0.6
0.6
8
11
10
 9
9
116
18
200
 23
23
307
96
466
 31
31
421
21
278
 3
3
34
49
131
 14
14
192
29
463
 63
63
854
40
2242
 13
13
170
10
175
 9
9
121
87
226
 10
10
134
31
248
 32
32
431
128
529
 5
5
72
29
111
 0.5
0.5
7
8
4
 19
19
259
12
537
 0.7
0.7
10
13
8
 35
35
475
181
627
 6
6
81
24
114
 5
5
66
78
92
 23
23
304
84
288
 11
11
153
29
287
 9
9
127
31
271
 12
12
159
27
213
 5
5
63
25
91
 15
15
198
29
430
 100
100
1348
61
3604
 3
3
40
32
69
 7
7
92
25
157
 7
7
89
25
157
 19
19
257
28
237
 27
27
361
18
263
 31
31
424
26
496
 33
33
446
67
662
 51
51
683
57
652
 5
5
72
35
62
Evolution
Species Conservation
PhosphoNET % Identity:
PhosphoNET % Similarity:
Homologene %
Identity:
PhosphoNET % Identity:
PhosphoNET % Similarity:
Homologene %
Identity:
 100
100
100
100 0
0
0
99 95.5
95.5
96.8
- -
-
-
98 -
-
-
- 91.2
91.2
92.4
99 -
-
-
- 68.5
68.5
81
99 99
99
99.5
99 -
-
-
- 69.8
69.8
82.3
- 69.7
69.7
81.4
- 66.7
66.7
79
83 68.1
68.1
80.6
71 -
-
-
- 62.1
62.1
75.1
- -
-
-
- 60.6
60.6
74.6
- -
-
-
- -
-
-
- -
-
-
- -
-
-
- -
-
-
- -
-
-
- 25.3
25.3
38
-
For a wider analysis go to PhosphoNET Evolution in PhosphoNET
Binding Proteins
Examples of known interacting proteins
hiddentext
| No. | Name – UniProt ID |
|---|---|
| 1 | GRIA4 - P48058 |
| 2 | GJA3 - Q9Y6H8 |
| 3 | YWHAE - P62258 |
| 4 | HABP4 - Q5JVS0 |
| 5 | AFAP1 - Q8N556 |
| 6 | GSK3A - P49840 |
| 7 | TIAM1 - Q13009 |
| 8 | GRM5 - P41594 |
| 9 | YWHAG - P61981 |
| 10 | PDLIM5 - Q96HC4 |
| 11 | DVL2 - O14641 |
| 12 | CHAT - P28329 |
| 13 | PEBP1 - P30086 |
| 14 | GRIN2B - Q13224 |
| 15 | PA2G4 - Q9UQ80 |
Regulation
Activation:
Activated by calcium, diacylglycerol, and acidic phospholipids such as phosphatidylserine. Phosphorylation of Thr-514 induces preactivation of PKC-gamma, which permits autophosphorylation at Thr-655 and Thr-674, which are required for full activation.
Inhibition:
NA
Synthesis:
NA
Degradation:
NA
Known Upstream Kinases
For further details on these substrates click on the Substrate Short Name or UniProt ID. Phosphosite Location is hyperlinked to PhosphoNET
predictions.
Based on in vitro and/or in vivo phosphorylation data
| Kinase Short Name | UniProt ID (Human) | Phosphosite Location | Phosphosite Sequence | Effect of Phosphorylation |
|---|
Known Downstream Substrates
For further details on these substrates click on the Substrate Short Name or UniProt ID. Phosphosite Location is hyperlinked to PhosphoNET
predictions.
Based on in vitro and/or in vivo phosphorylation data
| Substrate Short Name | UniProt ID (Human) | Phosphosite Location | Phosphosite Sequence | Effect of Phosphorylation |
|---|
| BARK1 (GRK2, ADRBK1) | P25098 | S29 | ATPAARASKKILLPE | + |
| C5aR | P21730 | S334 | SVVRESKSFTRSTVD | |
| CD5 | P06127 | T434 | MSFHRNHTATVRSHA | |
| CD5 | P06127 | T436 | FHRNHTATVRSHAEN | |
| ChAT | P28329 | S464 | LLKHMTQSSRKLIRA | |
| ChAT | P28329 | S465 | LKHMTQSSRKLIRAD | |
| ChAT | P28329 | S558 | VPTYESASIRRFQEG | |
| ChAT | P28329 | S594 | HKAAVPASEKLLLLK | |
| ChAT | P28329 | T373 | TVLVKDSTNRDSLDM | |
| Cx43 | P17302 | S367 | QRPSSRASSRASSRP | |
| DAB2 | P98082 | S24 | QAAPKAPSKKEKKKG | |
| DGK-G | P49619 | S779 | MGPPQKSSFFSLRRK | |
| DGK-G | P49619 | S782 | PQKSSFFSLRRKSRS | |
| DRAK2 (STK17B) | O94768 | S351 | PEDSSMVSKRFRFDD | |
| GluR4 | P48058 | S862 | IRNKARLSITGSVGE | |
| GSK3a | P49840 | S21 | SGRARTSSFAEPGGG | - |
| GSK3b | P49841 | S9 | SGRPRTTSFAESCKP | - |
| HMGA1 | P17096 | S44 | PGTALVGSQKEPSEV | |
| HMGA1 | P17096 | S64 | PRGRPKGSKNKGAAK | |
| KIR3DL1 | P43629 | S415 | QRKITRPSQRPKTPP | |
| Kv3.4 | Q03721 | S15 | SSYRGRKSGNKPPSK | |
| Kv3.4 | Q03721 | S21 | KSGNKPPSKTCLKEE | |
| Kv3.4 | Q03721 | S8 | MISSVCVSSYRGRKS | |
| Kv3.4 | Q03721 | S9 | ISSVCVSSYRGRKSG | |
| mGluR5 | P41594 | S840 | VRSAFTTSTVVRMHV | |
| MMP14 | P50281 | T567 | FFFRRHGTPRRLLYC | |
| NMDAR1 (Glutamate) | Q05586 | S890 | ITSTLASSFKRRRSS | |
| p70S6Kb (RPS6KB2) | Q9UBS0 | S473 | PPSGTKKSKRGRGRP | + |
| PEBP1 | P30086 | S153 | RGKFKVASFRKKYEL | |
| PKCg (PRKCG) | P05129 | T655 | TRAAPALTPPDRLVL | + |
| PKCg (PRKCG) | P05129 | T674 | QADFQGFTYVNPDFV | + |
| Tau iso8 | P10636-8 | S258 | PDLKNVKSKIGSTEN | |
| Tau iso8 | P10636-8 | S293 | NVQSKCGSKDNIKHV | |
| Tau iso8 | P10636-8 | S324 | KVTSKCGSLGNIHHK | |
| Tau iso8 | P10636-8 | S352 | DFKDRVQSKIGSLDN |
Protein Kinase Specificity
Matrix of observed frequency (%) of amino acids in aligned protein substrate phosphosites
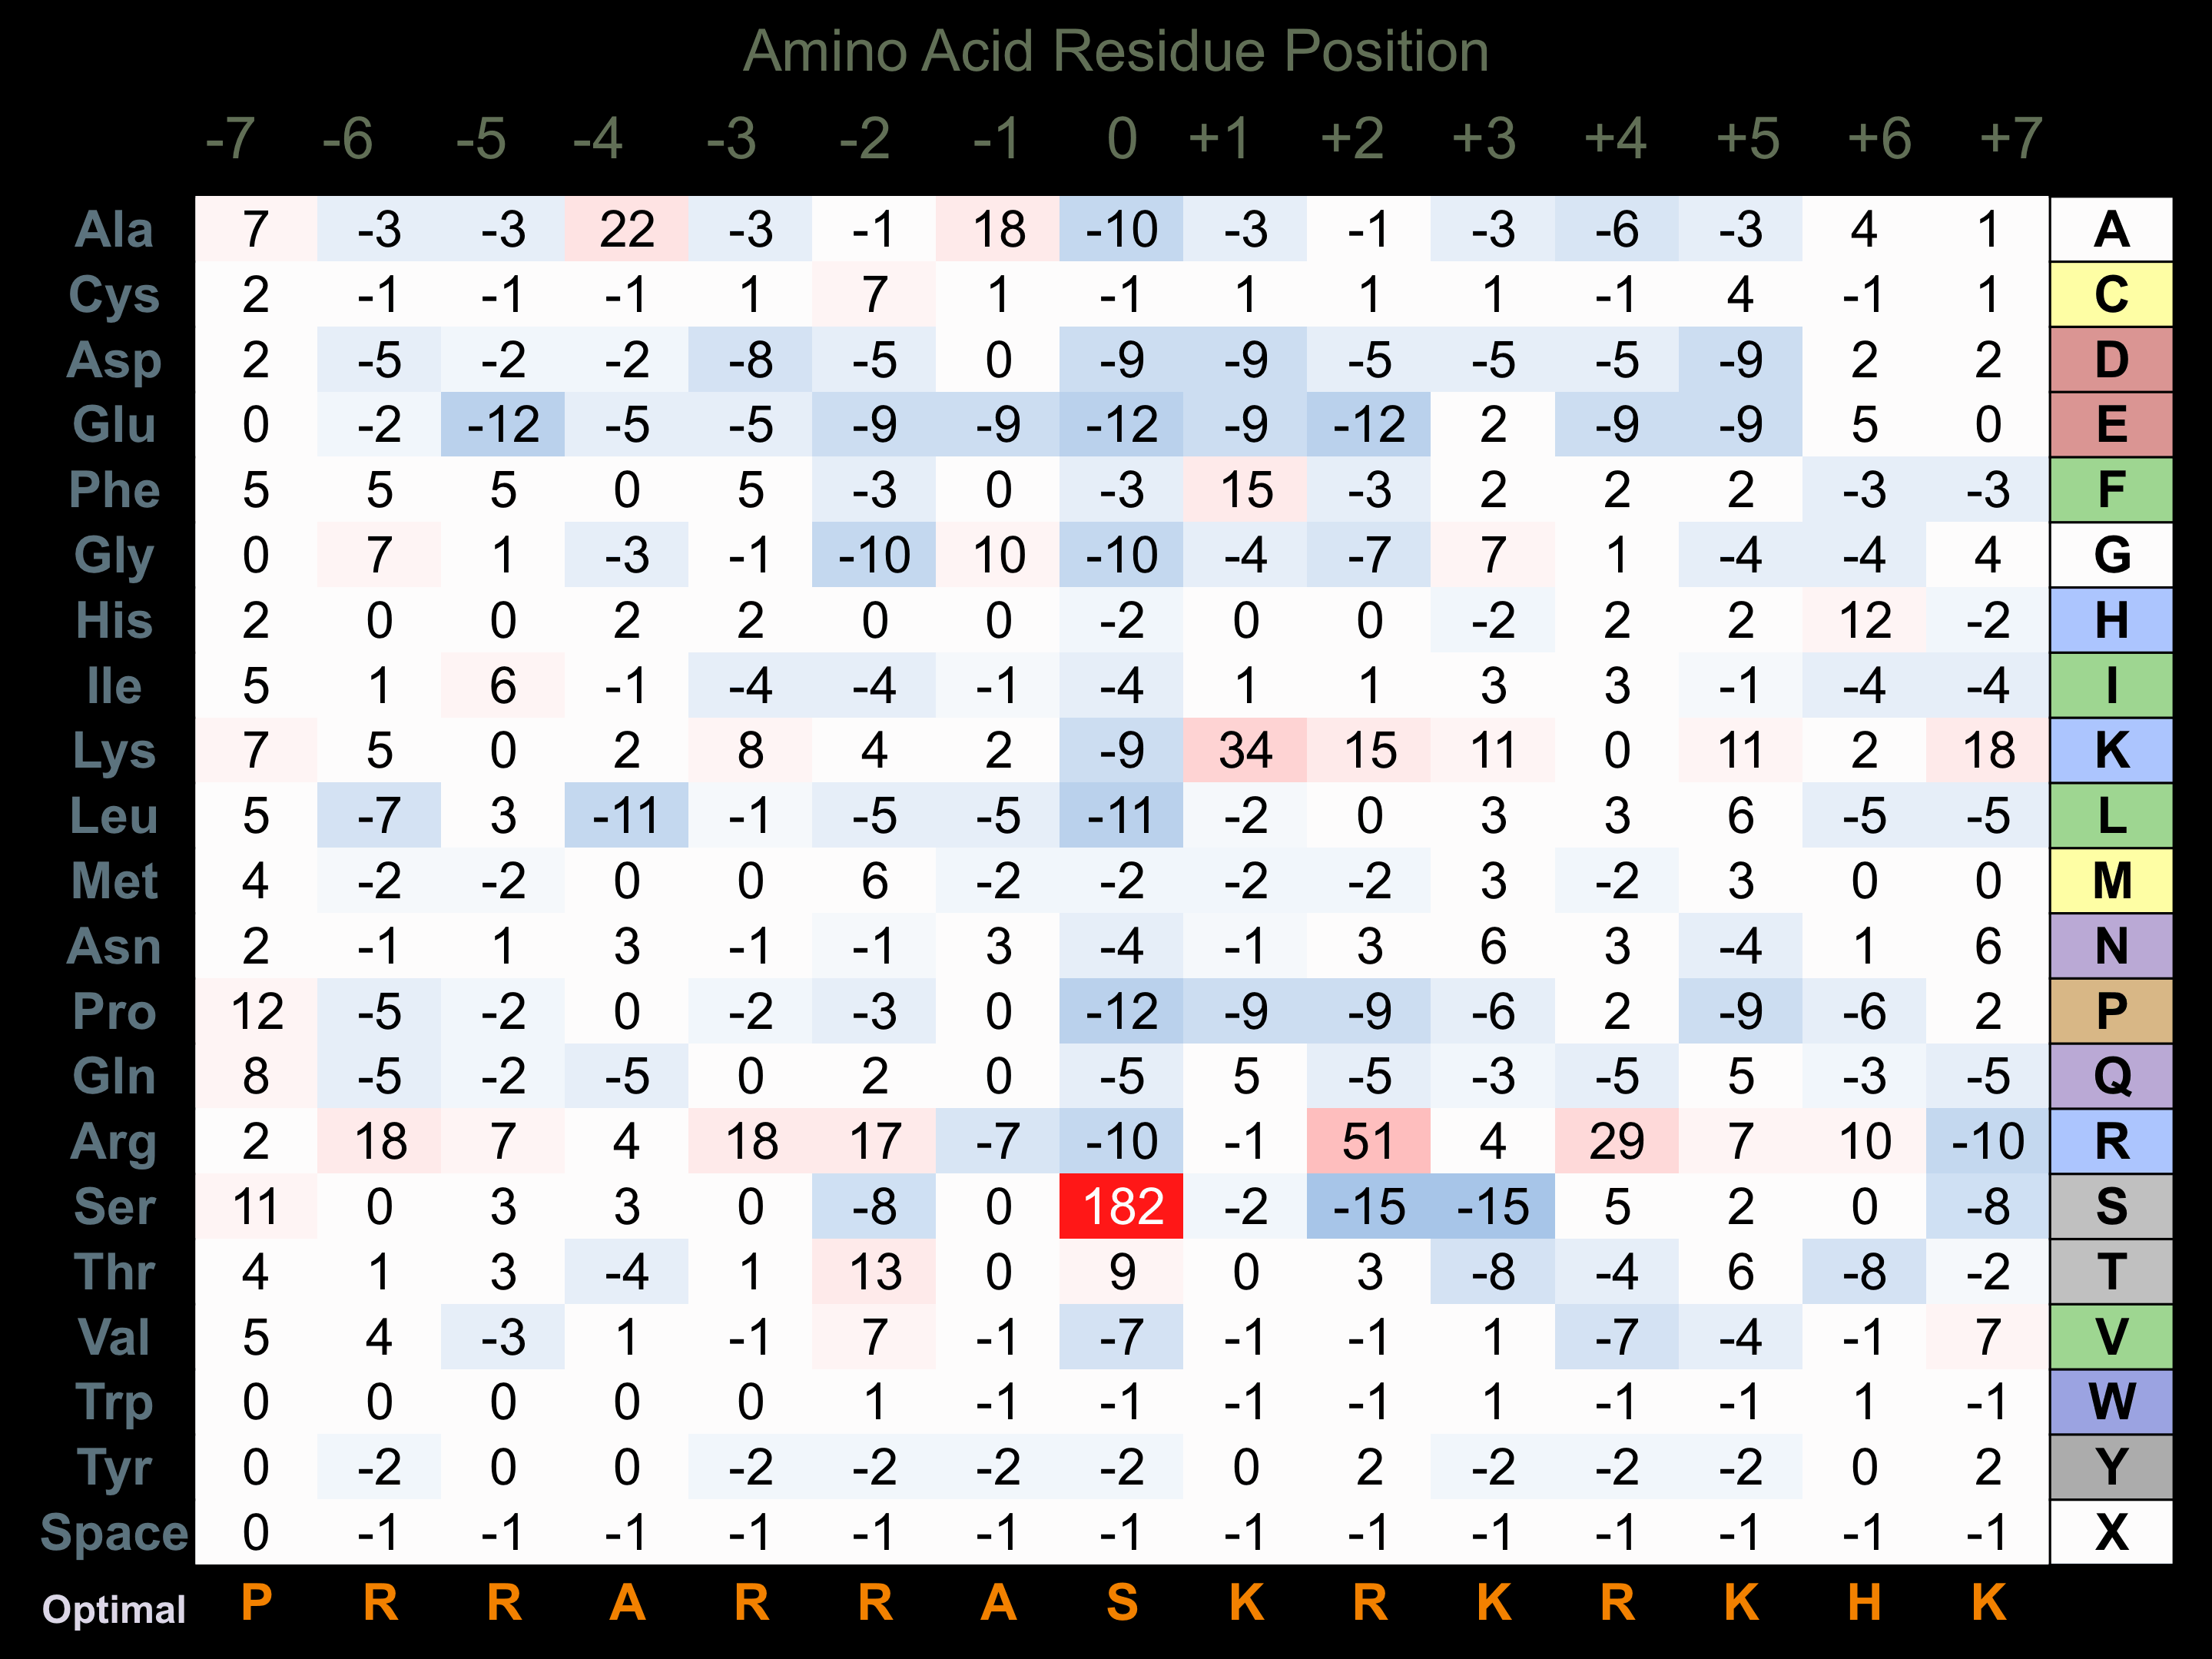
Matrix Type:
Experimentally derived from alignment of 51 known protein substrate phosphosites.
Domain #:
1
Inhibitors
For further details on these inhibitors click on the Compound Name and enter it into DrugKiNET or click on the ID's
Based on in vitro and/or in vivo phosphorylation data
| Compound Name | KD, Ki or IC50 (nM) | PubChem ID | ChEMBL ID | PubMed ID |
|---|
Disease Linkage
General Disease Association:
Neurological disorders
Specific Diseases (Non-cancerous):
Spinocerebellar ataxia Type 14 (SCA14); Spinocerebellar ataxia Type14
Comments:
Spinocerebellar Ataxia Type 14 (SCA14) is related to the CDK-mediated phosphorylation and removal of Cdc6, and is also related to Nanog in Mammalian ESC Pluripotency. SCA14 is related to ataxia where neuronal damage occurs, inhibiting the patient's control of movement. SCA14 is also characterized by loss of coordination, loss of balance, and the development of an abnormal gait. The three mutations commonly seen in SCA14 are H101Y, S119P, and G128D.
Gene Expression in Cancers:
TranscriptoNET (www.transcriptonet.ca) analysis with mRNA expression data retrieved from the National Center for Biotechnology Information's Gene Expression Omnibus (GEO) database, which was normalized against 60 abundantly and commonly found proteins, indicated altered expression for this protein kinase as shown here as the percent change from normal tissue controls (%CFC) as supported with the Student T-test in the following types of human cancers: Prostate cancer - metastatic (%CFC= -53, p<0.0001); and Prostate cancer - primary (%CFC= +82, p<0.0001) The COSMIC website notes an up-regulated expression score for PKCg in diverse human cancers of 280, which is 0.6-fold of the average score of 462 for the human protein kinases. The down-regulated expression score of 0 for this protein kinase in human cancers was 100% lower than the average score of 60 for the human protein kinases.
Mutagenesis Experiments:
Insertional mutagenesis studies in mice have not yet revealed a role for this protein kinase in mouse cancer oncogenesis.
Mutation Rate in All Cancers:
Percent mutation rates per 100 amino acids length in human cancers: 0.12 % in 25332 diverse cancer specimens. This rate is 1.65-fold higher than the average rate of 0.075 % calculated for human protein kinases in general.
Mutation Rate in Specific Cancers:
Highest percent mutation rates per 100 amino acids length in human cancers: 0.82 % in 805 skin cancers tested; 0.5 % in 1093 large intestine cancers tested; 0.47 % in 575 stomach cancers tested; 0.22 % in 1941 lung cancers tested; 0.14 % in 1270 liver cancers tested.
Frequency of Mutated Sites:
None > 9 in 20,615 cancer specimens
Comments:
Only 2 deletions, and no insertions or complex mutations are noted on the COSMIC website. About 39% of the point mutations are silent and do not change the amino acid sequence of the protein kinase.