
Nomenclature
Short Name:
DYRK2
Full Name:
Dual-specificity tyrosine-phosphorylation regulated kinase 2
Alias:
- EC 2.7.12.1
Classification
Type:
Protein-serine/threonine kinase
Group:
CMGC
Family:
DYRK
SubFamily:
Dyrk2

Specific Links
Structure
Mol. Mass (Da):
66,652
# Amino Acids:
601
# mRNA Isoforms:
2
mRNA Isoforms:
66,652 Da (601 AA; Q92630); 59,715 Da (528 AA; Q92630-2)
4D Structure:
NA
1D Structure:
3D Image (rendered using PV Viewer):
PDB ID
Subfamily Alignment

Domain Distribution:
| Start | End | Domain |
|---|---|---|
| 222 | 535 | Pkinase |
Kinexus Products
Click on entries below for direct links to relevant products from Kinexus for this protein kinase.
hiddentext
Post-translation Modifications
For detailed information on phosphorylation of this kinase go to PhosphoNET
Serine phosphorylated:
S30, S142, S385, S442+, S449.
Threonine phosphorylated:
T106+, T381+, T525.
Tyrosine phosphorylated:
Y380+, Y382+, Y464.
Distribution
Based on gene microarray analysis from the NCBI
Human Tissue Distribution
% Max Expression:
Mean Expression:
Number of Samples:
Standard Deviation:
% Max Expression:
Mean Expression:
Number of Samples:
Standard Deviation:
 64
64
889
58
1043
 2
2
32
27
32
 11
11
150
7
220
 43
43
602
186
1434
 55
55
775
45
588
 43
43
600
158
2583
 32
32
446
63
550
 100
100
1397
83
2748
 63
63
880
31
636
 4
4
60
163
66
 4
4
51
49
95
 42
42
586
332
600
 7
7
104
51
113
 3
3
48
21
56
 7
7
96
38
201
 2
2
28
30
17
 2
2
33
383
41
 6
6
84
22
164
 12
12
171
160
115
 42
42
590
215
616
 4
4
55
34
96
 6
6
89
41
89
 7
7
100
19
86
 4
4
58
23
101
 8
8
111
34
125
 92
92
1287
109
2234
 5
5
71
54
49
 6
6
78
22
140
 6
6
85
22
103
 3
3
46
56
40
 52
52
723
48
626
 99
99
1382
66
2718
 13
13
186
95
462
 61
61
853
109
713
 4
4
54
70
61
Evolution
Species Conservation
PhosphoNET % Identity:
PhosphoNET % Similarity:
Homologene %
Identity:
PhosphoNET % Identity:
PhosphoNET % Similarity:
Homologene %
Identity:
 100
100
100
100 98.5
98.5
98.8
100 99.7
99.7
99.8
100 -
-
-
98.5 -
-
-
99 98.3
98.3
99
99 -
-
-
- 97
97
98.5
97.5 59.7
59.7
71.9
98 -
-
-
- 78.7
78.7
83
- 81.4
81.4
84.5
93 64.6
64.6
75
89 83.7
83.7
89.8
85 -
-
-
- 43.4
43.4
55
72.5 -
-
-
- 45.7
45.7
55.6
73.5 63.7
63.7
73.5
- -
-
-
- -
-
-
- -
-
-
- 21.3
21.3
36.6
- 27.3
27.3
41.3
- -
-
-
46
For a wider analysis go to PhosphoNET Evolution in PhosphoNET
Binding Proteins
Examples of known interacting proteins
hiddentext
| No. | Name – UniProt ID |
|---|---|
| 1 | DCAF7 - P61962 |
Regulation
Activation:
Autophosphorylates on tyrosine residues. Functions downstream of ATM.
Inhibition:
NA
Synthesis:
NA
Degradation:
Under normal conditions, polyubiquitinated in the nucleus by MDM2, leading to its proteasomal degradation. Phosphorylation on Thr-106 and Ser-442 by ATM in response to genotoxic stress disrupts MDM2 binding and prevents MDM2-mediated ubiquitination and subsequent proteasomal degradation. Polyubiquitinated by SIAH2, leading to its proteasomal degradation. Polyubiquitinated by SIAH2 occurs under normal conditions, and is enhanced in response to hypoxia.
Known Upstream Kinases
For further details on these substrates click on the Substrate Short Name or UniProt ID. Phosphosite Location is hyperlinked to PhosphoNET
predictions.
Based on in vitro and/or in vivo phosphorylation data
| Kinase Short Name | UniProt ID (Human) | Phosphosite Location | Phosphosite Sequence | Effect of Phosphorylation |
|---|
Known Downstream Substrates
For further details on these substrates click on the Substrate Short Name or UniProt ID. Phosphosite Location is hyperlinked to PhosphoNET
predictions.
Based on in vitro and/or in vivo phosphorylation data
| Substrate Short Name | UniProt ID (Human) | Phosphosite Location | Phosphosite Sequence | Effect of Phosphorylation |
|---|
| 4E-BP1 | Q13541 | S100 | SQSHLRNSPEDKRAG | |
| 4E-BP1 | Q13541 | S64 | FLMECRNSPVTKTPP | |
| CaRHSP1 | Q9Y2V2 | S30 | TPRSRERSPSPLRGN | |
| CaRHSP1 | Q9Y2V2 | S32 | RSRERSPSPLRGNVV | |
| CaRHSP1 | Q9Y2V2 | S41 | LRGNVVPSPLPTRRT | |
| CRMP1 | Q14194 | S522 | PAPSAKSSPSKHQPP | |
| CRMP2 (DPYSL2) | Q16555 | S522 | PASSAKTSPAKQQAP | |
| CRMP4 | Q6DEN2 | S636 | PAGSARGSPTRPNPP | |
| eIF2B-e | Q13144 | S544 | EPDSRGGSPQMDDIK | - |
| GLI2 | P10070 | S60 | PEGLRPASPLALTQG | |
| GLI2 | P10070 | S697 | GLARGAYSPRPPSIS | |
| GYS1 | P13807 | S641 | YRYPRPASVPPSPSL | - |
| GYS2 | P54840 | S641 | FKYPRPSSVPPSPSG | - |
| H3.1 | P68431 | T45 | PHRYRPGTVALREIR | |
| Jun (c-Jun) | P05412 | S243 | PGETPPLSPIDMESQ | - |
| p53 | P04637 | S46 | AMDDLMLSPDDIEQW | + |
| STAT3 | P40763 | S727 | NTIDLPMSPRTLDSL | - |
| Tau iso8 | P10636-8 | T212 | TPGSRSRTPSLPTPP | |
| TERT | O14746 | S457 | QLLRQHSSPWQVYGF | - |
Protein Kinase Specificity
Matrix of observed frequency (%) of amino acids in aligned protein substrate phosphosites
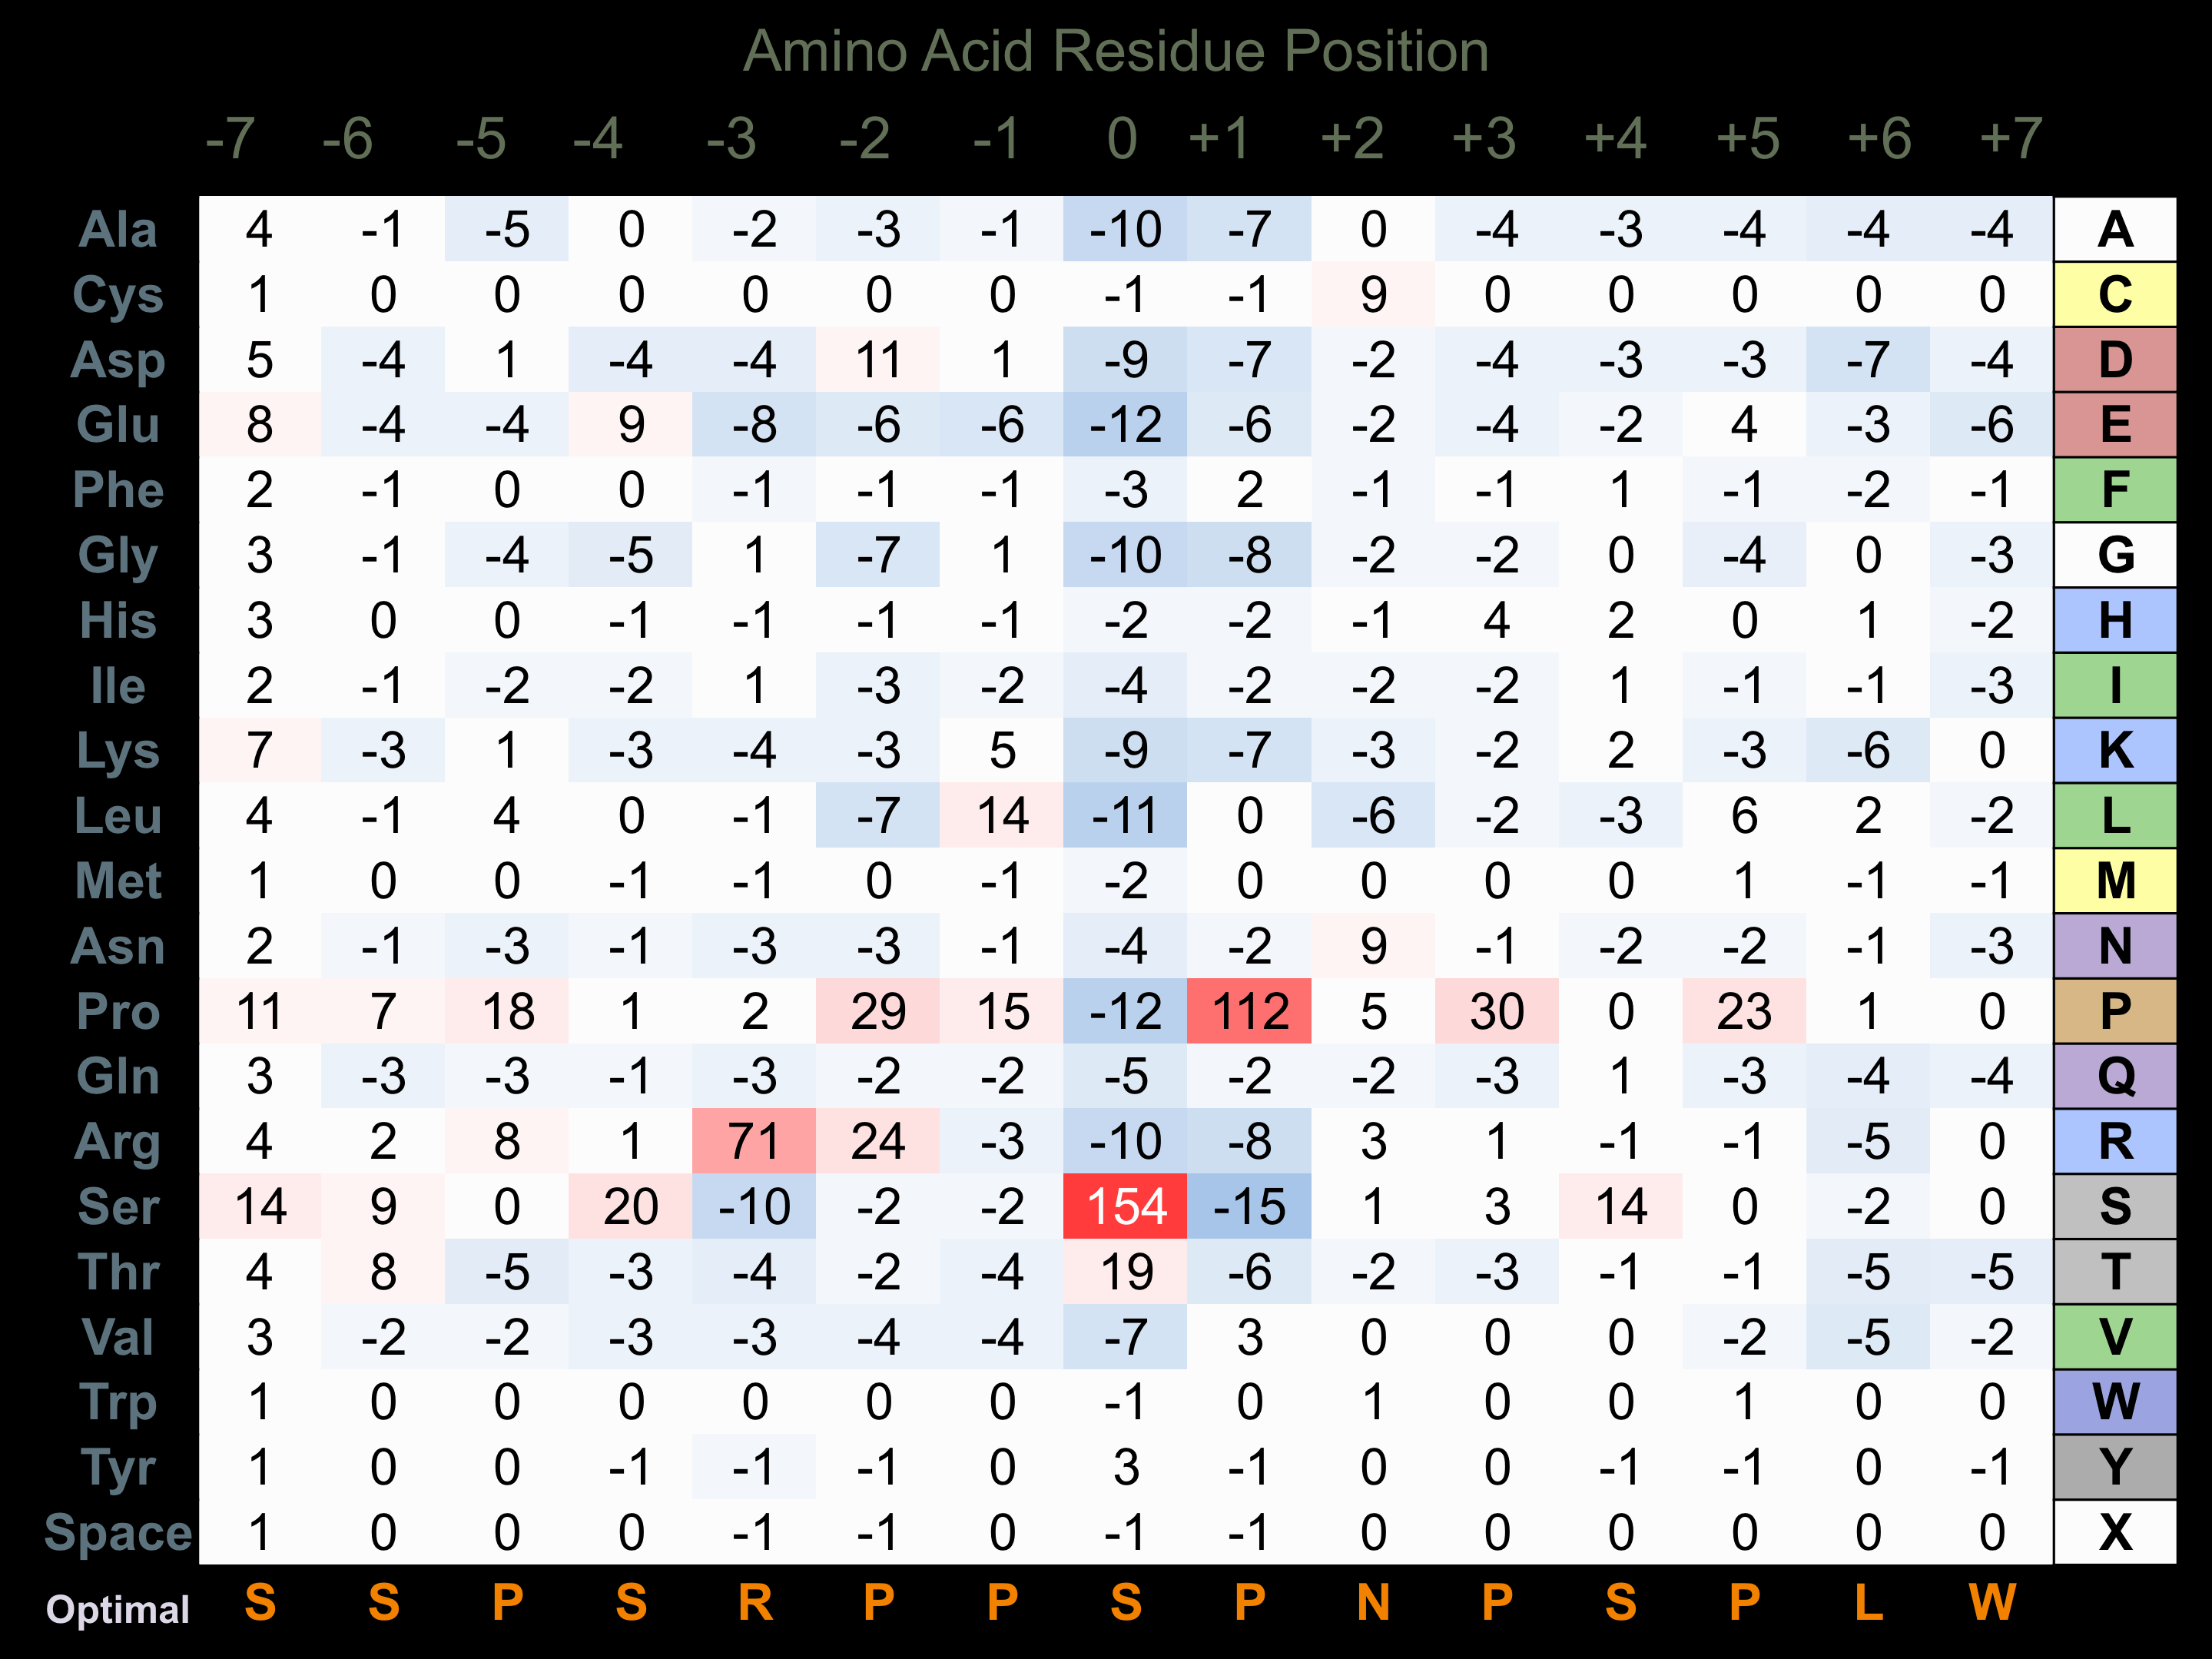
Matrix Type:
Predicted from the application of the Kinexus Kinase Substrate Predictor Version 2.0 algorithm, which was trained with over 10,000 kinase-protein substrate pairs and 8,000 kinase-peptide substrate pairs.
Domain #:
1
Inhibitors
For further details on these inhibitors click on the Compound Name and enter it into DrugKiNET or click on the ID's
Based on in vitro and/or in vivo phosphorylation data
| Compound Name | KD, Ki or IC50 (nM) | PubChem ID | ChEMBL ID | PubMed ID |
|---|
Disease Linkage
General Disease Association:
Cancer
Specific Cancer Types:
Breast cancer; Non-small cell lung cancer (NSCLC); Pulmonary adenocarcinomas
Comments:
DYRK2 appears to be a tumour suppressor protein (TSP). Abnormal expression of DYRK2 have been associated with various forms of human cancer. In breast cancer cells, DYRK2 negatively regulates the stability of Snail, a transcription factor that regulates the epithelial-mesenchymal transistion (EMT). Knock-down of DYRK2 expression in breast cancer cells promotes EMT and tumour invasion both in vitro and in vivo. In addition, tumours with low expression of DYRK2 were correlated with a significantly lower patient survival and higher metastasis rate than tumours with high DYRK2 expression. Therefore, the DYRK2 protein appears to be a critical suppressor of cancer invasion and metastasis. Similarly, the 5-year survival rates of pulmonary adenocarcinoma patients was significant higher for those with DYRK2-positive tumours (89. 2%) than those with DYRK2-negative tumours (66. 3%), indicating a critical role for DYRK2 as a tumour suppressor in this cancer type as well.
Gene Expression in Cancers:
TranscriptoNET (www.transcriptonet.ca) analysis with mRNA expression data retrieved from the National Center for Biotechnology Information's Gene Expression Omnibus (GEO) database, which was normalized against 60 abundantly and commonly found proteins, indicated altered expression for this protein kinase as shown here as the percent change from normal tissue controls (%CFC) as supported with the Student T-test in the following types of human cancers: Barrett's esophagus epithelial metaplasia (%CFC= +115, p<0.0002); Bladder carcinomas (%CFC= +109, p<0.0004); Oral squamous cell carcinomas (OSCC) (%CFC= +202, p<0.0005); Ovary adenocarcinomas (%CFC= +96, p<0.002); Prostate cancer - primary (%CFC= -73, p<0.0001); Skin squamous cell carcinomas (%CFC= +54, p<0.018); and Uterine leiomyomas from fibroids (%CFC= +90, p<0.01). The COSMIC website notes an up-regulated expression score for DYRK2 in diverse human cancers of 607, which is 1.3-fold of the average score of 462 for the human protein kinases. The down-regulated expression score of 35 for this protein kinase in human cancers was 0.6-fold of the average score of 60 for the human protein kinases.
Mutagenesis Experiments:
Insertional mutagenesis studies in mice have not yet revealed a role for this protein kinase in mouse cancer oncogenesis.
Mutation Rate in All Cancers:
Percent mutation rates per 100 amino acids length in human cancers: 0.08 % in 24828 diverse cancer specimens. This rate is very similar (+ 3% higher) to the average rate of 0.075 % calculated for human protein kinases in general.
Mutation Rate in Specific Cancers:
Highest percent mutation rates per 100 amino acids length in human cancers: 0.46 % in 1270 large intestine cancers tested; 0.33 % in 603 endometrium cancers tested; 0.31 % in 864 skin cancers tested; 0.2 % in 589 stomach cancers tested.
Frequency of Mutated Sites:
None > 5 in 20,111 cancer specimens, many are silent mutations
Comments:
Only 2 deletions, no insertions or complex mutations are noted on the COSMIC website.