
Nomenclature
Short Name:
EPHA4
Full Name:
Ephrin type-A receptor 4
Alias:
- EC 2.7.1.112
- EC 2.7.10.1
- TYRO1
- Tyrosine-protein kinase receptor SEK
- EPH receptor A4
- HEK8
- Receptor protein-tyrosine kinase HEK8
- SEK
Classification
Type:
Protein-tyrosine kinase
Group:
TK
Family:
Eph
SubFamily:
NA

Specific Links
Structure
Mol. Mass (Da):
109,860
# Amino Acids:
986
# mRNA Isoforms:
2
mRNA Isoforms:
109,860 Da (986 AA; P54764); 104,507 Da (935 AA; P54764-2)
4D Structure:
Interacts with the src family kinase, p59-Fyn, through the major phosphorylation site at position Tyr-602. Interacts with NGEF/ephexin-1
1D Structure:
3D Image (rendered using PV Viewer):
PDB ID
Subfamily Alignment
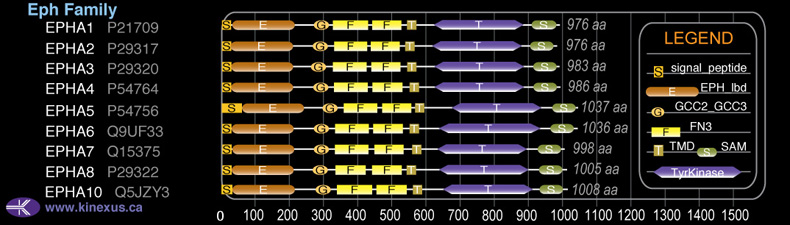
Domain Distribution:
Kinexus Products
Click on entries below for direct links to relevant products from Kinexus for this protein kinase.
hiddentext
Post-translation Modifications
For detailed information on phosphorylation of this kinase go to PhosphoNET
Acetylated:
K693K671.
N-GlcNAcylated:
N235, N340, N408, N545.
Serine phosphorylated:
S349, S350, S637, S741, S887.
Threonine phosphorylated:
T117, T168, T354, T595, T601, T781, T957.
Tyrosine phosphorylated:
Y596, Y602+, Y779, Y798-, Y928-.
Ubiquitinated:
K735.
Distribution
Based on gene microarray analysis from the NCBI
Human Tissue Distribution
% Max Expression:
Mean Expression:
Number of Samples:
Standard Deviation:
% Max Expression:
Mean Expression:
Number of Samples:
Standard Deviation:
 25
25
1062
43
961
 0.5
0.5
20
14
16
 8
8
341
16
875
 10
10
433
168
584
 11
11
468
52
374
 2
2
68
73
62
 3
3
119
59
363
 8
8
359
47
747
 5
5
210
10
183
 2
2
66
147
62
 3
3
114
33
421
 15
15
645
140
682
 4
4
180
28
550
 2
2
81
9
94
 6
6
265
31
980
 0.3
0.3
12
28
12
 1
1
49
348
192
 4
4
180
24
468
 1
1
46
134
80
 20
20
845
168
678
 6
6
238
32
872
 4
4
171
32
526
 4
4
186
26
616
 6
6
271
24
607
 5
5
205
32
681
 15
15
630
116
650
 2
2
101
31
242
 10
10
446
24
1606
 4
4
162
24
302
 2
2
95
70
105
 23
23
985
18
713
 100
100
4295
45
9055
 6
6
255
120
664
 14
14
622
135
571
 1
1
46
74
36
Evolution
Species Conservation
PhosphoNET % Identity:
PhosphoNET % Similarity:
Homologene %
Identity:
PhosphoNET % Identity:
PhosphoNET % Similarity:
Homologene %
Identity:
 100
100
100
100 41.9
41.9
61.4
100 99.9
99.9
100
100 -
-
-
99 -
-
-
100 93.4
93.4
94.5
99 -
-
-
- 98.5
98.5
99.5
99 62.2
62.2
78.1
99 -
-
-
- 96.2
96.2
98.3
- 94.2
94.2
97.4
94 89
89
94.8
90 64.3
64.3
79.1
82 -
-
-
- -
-
-
- -
-
-
- -
-
-
40 -
-
-
- -
-
-
- -
-
-
- -
-
-
- -
-
-
- -
-
-
- -
-
-
-
For a wider analysis go to PhosphoNET Evolution in PhosphoNET
Binding Proteins
Examples of known interacting proteins
hiddentext
| No. | Name – UniProt ID |
|---|---|
| 1 | EFNB2 - P52799 |
| 2 | EFNA3 - P52797 |
| 3 | EFNA4 - P52798 |
| 4 | EFNA4 - P52798 |
| 5 | EFNA1 - P20827 |
| 6 | EFNA3 - P52797 |
| 7 | EFNA5 - P52803 |
| 8 | EFNB3 - Q15768 |
| 9 | NGEF - Q8N5V2 |
| 10 | FYN - P06241 |
| 11 | FGFR2 - P21802 |
| 12 | FGFR1 - P11362 |
| 13 | FGFR3 - P22607 |
| 14 | FGFR4 - P22455 |
| 15 | MLLT4 - P55196 |
Regulation
Activation:
Phosphorylation at Tyr-602 interaction with Fyn.
Inhibition:
Phosphorylation at Tyr-928 inhibits phosphotransferase activity.
Synthesis:
NA
Degradation:
NA

Known Upstream Kinases
For further details on these substrates click on the Substrate Short Name or UniProt ID. Phosphosite Location is hyperlinked to PhosphoNET
predictions.
Based on in vitro and/or in vivo phosphorylation data
| Kinase Short Name | UniProt ID (Human) | Phosphosite Location | Phosphosite Sequence | Effect of Phosphorylation |
|---|
Known Downstream Substrates
For further details on these substrates click on the Substrate Short Name or UniProt ID. Phosphosite Location is hyperlinked to PhosphoNET
predictions.
Based on in vitro and/or in vivo phosphorylation data
| Substrate Short Name | UniProt ID (Human) | Phosphosite Location | Phosphosite Sequence | Effect of Phosphorylation |
|---|
Protein Kinase Specificity
Matrix of observed frequency (%) of amino acids in aligned protein substrate phosphosites
Matrix Type:
Experimentally derived from alignment of 7 known protein substrate phosphosites and 34 peptides phosphorylated by recombinant EphA4 in vitro tested in-house by Kinexus.
Domain #:
1
Inhibitors
For further details on these inhibitors click on the Compound Name and enter it into DrugKiNET or click on the ID's
Based on in vitro and/or in vivo phosphorylation data
| Compound Name | KD, Ki or IC50 (nM) | PubChem ID | ChEMBL ID | PubMed ID |
|---|
Disease Linkage
General Disease Association:
Infectious disease; Neurological disorders
Specific Diseases (Non-cancerous):
Staphyloenterotoxemia; ALS
Comments:
EphA4-null mice possess defects in corticospinal tract and anterior commissure. Q40A and E42A mutations lead to 10-fold decreased affinity for EFNB2. >EphA4 may increase the vulnerability of (motor) neurons to axonal degeneration in amyotrophic lateral sclerosis (ALS) and may represent a target for therapeutic intervention of this disease. ALS is a rare neuronal disease affecting motor control. Characteristics of ALS can include cramping, stiffness, muscle twitching, weakness, slurring words, chewing difficulties, and dysphagia (difficulty swallowing).Those motor neurons that are most vulnerable to degeneration in ALS express higher levels of EphA4, and this kinase appears to inhibit neuromuscular re-innervation by axotomized motor neurons. In humans with ALS, EphA4 expression is inversely linked with disease onset and survival, and loss-of-function mutations in EphA4 are correlated with longer survival. Inhibition of EphA4 signalling in mutant SOD zebrafish, mouse and rat models of ALS improves their phenotype. Furthermore, knockdown of EphA4 also rescues the axonopathy induced by expression of mutant TAR DNA-binding protein 43 (TDP-43), another protein causing familial ALS, and the axonopathy induced by knockdown of survival of motor neuron 1, a model for spinomuscular atrophy.
Gene Expression in Cancers:
TranscriptoNET (www.transcriptonet.ca) analysis with mRNA expression data retrieved from the National Center for Biotechnology Information's Gene Expression Omnibus (GEO) database, which was normalized against 60 abundantly and commonly found proteins, indicated altered expression for this protein kinase as shown here as the percent change from normal tissue controls (%CFC) as supported with the Student T-test in the following types of human cancers: Brain glioblastomas (%CFC= +1688, p<0.0001); Brain oligodendrogliomas (%CFC= +2030, p<0.022); Oral squamous cell carcinomas (OSCC) (%CFC= +130, p<0.03); Papillary thyroid carcinomas (PTC) (%CFC= +76, p<0.028); and Uterine leiomyomas (%CFC= -75, p<0.016). The COSMIC website notes an up-regulated expression score for EPHA4 in diverse human cancers of 376, which is 0.8-fold of the average score of 462 for the human protein kinases. The down-regulated expression score of 0 for this protein kinase in human cancers was 100% lower than the average score of 60 for the human protein kinases.
Mutagenesis Experiments:
Insertional mutagenesis studies in mice have not yet revealed a role for this protein kinase in mouse cancer oncogenesis.
Mutation Rate in All Cancers:
Percent mutation rates per 100 amino acids length in human cancers: 0.11 % in 25561 diverse cancer specimens. This rate is a modest 1.47-fold higher than the average rate of 0.075 % calculated for human protein kinases in general.
Mutation Rate in Specific Cancers:
Highest percent mutation rates per 100 amino acids length in human cancers: 0.63 % in 805 skin cancers tested; 0.51 % in 1119 large intestine cancers tested; 0.38 % in 589 stomach cancers tested; 0.29 % in 602 endometrium cancers tested; 0.18 % in 605 oesophagus cancers tested; 0.16 % in 1942 lung cancers tested; 0.16 % in 1270 liver cancers tested.
Frequency of Mutated Sites:
Most frequent mutations with the number of reports indicated in brackets: R728C (6)
Comments:
Only 4 deletions, 2 insertions, and no complex mutations are noted on the COSMIC website.