
Nomenclature
Short Name:
EPHA5
Full Name:
Ephrin type-A receptor 5
Alias:
- EC 2.7.1.112
- EC 2.7.10.1
- EHK1
- Eph homology kinase-1
- HEK7
- Tyrosine-protein kinase receptor EHK-1
Classification
Type:
Protein-tyrosine kinase
Group:
TK
Family:
Eph
SubFamily:
NA

Specific Links
Structure
Mol. Mass (Da):
114803
# Amino Acids:
1037
# mRNA Isoforms:
3
mRNA Isoforms:
114,803 Da (1037 AA; P54756); 112,624 Da (1015 AA; P54756-2); 107,699 Da (969 AA; P54756-3)
4D Structure:
NA
1D Structure:
3D Image (rendered using PV Viewer):
PDB ID
Subfamily Alignment
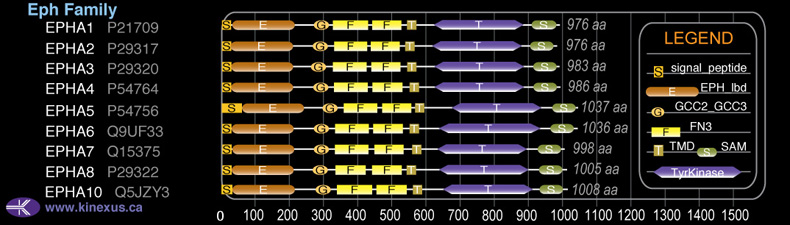
Domain Distribution:
Post-translation Modifications
For detailed information on phosphorylation of this kinase go to PhosphoNET
N-GlcNAcylated:
N264, N299, N369, N423, N436, N461.
Serine phosphorylated:
S4, S313, S318, S673, S822, S873, S953, S960, S964.
Threonine phosphorylated:
T197, T301, T649, T655, T676, T708, T835, T856.
Tyrosine phosphorylated:
Y295, Y650, Y656, Y713, Y790, Y796, Y833, Y967.
Ubiquitinated:
K387, K710.
Distribution
Based on gene microarray analysis from the NCBI
Human Tissue Distribution
% Max Expression:
Mean Expression:
Number of Samples:
Standard Deviation:
% Max Expression:
Mean Expression:
Number of Samples:
Standard Deviation:
 52
52
1108
32
1178
 1
1
27
16
43
 0.9
0.9
18
2
3
 15
15
308
111
545
 16
16
336
31
228
 11
11
227
91
789
 11
11
232
49
405
 21
21
452
33
577
 12
12
246
17
201
 2
2
40
119
52
 1
1
28
25
36
 18
18
373
210
458
 1
1
21
24
20
 1
1
21
12
28
 0.7
0.7
14
18
19
 0.6
0.6
12
21
12
 5
5
101
286
1528
 1
1
23
13
21
 1
1
29
107
34
 13
13
269
137
260
 1
1
24
21
29
 0.7
0.7
15
23
17
 1
1
24
20
22
 1
1
28
13
36
 0.7
0.7
14
18
16
 18
18
371
67
420
 0.9
0.9
18
27
21
 1
1
24
13
31
 1
1
21
11
21
 7
7
154
42
173
 14
14
289
24
282
 100
100
2112
41
4735
 0.1
0.1
2
46
1
 24
24
508
88
505
 23
23
496
57
748
Evolution
Species Conservation
PhosphoNET % Identity:
PhosphoNET % Similarity:
Homologene %
Identity:
PhosphoNET % Identity:
PhosphoNET % Similarity:
Homologene %
Identity:
 100
100
100
100 99.7
99.7
99.9
100 99.2
99.2
99.6
99 -
-
-
98 -
-
-
- 63.8
63.8
78.7
99 -
-
-
- 64
64
78.7
96 92.9
92.9
94.1
97 -
-
-
- 90.1
90.1
92.4
- 90.7
90.7
93.9
93.5 62.6
62.6
75.4
87 60.4
60.4
73.8
80 -
-
-
- -
-
-
- -
-
-
- -
-
-
- -
-
-
- -
-
-
- -
-
-
- -
-
-
- -
-
-
- -
-
-
- -
-
-
-
For a wider analysis go to PhosphoNET Evolution in PhosphoNET
Binding Proteins
Examples of known interacting proteins
hiddentext
| No. | Name – UniProt ID |
|---|---|
| 1 | EFNA1 - P20827 |
| 2 | EFNA4 - P52798 |
| 3 | EFNA3 - P52797 |
| 4 | EFNA5 - P52803 |
| 5 | EFNA3 - P52797 |
| 6 | EFNA4 - P52798 |
| 7 | EFNA2 - O43921 |
| 8 | STAT3 - P40763 |
| 9 | MLLT4 - P55196 |
Regulation
Activation:
Activated by binding ephrin-A1, A2, A3, A4 or A5. Phosphorylation is stimulated by the ligand EFNA5.
Inhibition:
Dephosphorylation upon stimulation by glucose, inhibits EPHA5 forward signaling and results in insulin secretion
Synthesis:
NA
Degradation:
NA
Protein Kinase Specificity
Matrix of observed frequency (%) of amino acids in aligned protein substrate phosphosites
Matrix Type:
Predicted from the application of the Kinexus Kinase Substrate Predictor Version 2.0 algorithm, which was trained with over 10,000 kinase-protein substrate pairs and 8,000 kinase-peptide substrate pairs.
Domain #:
1
Inhibitors
For further details on these inhibitors click on the Compound Name and enter it into DrugKiNET or click on the ID's
Based on in vitro and/or in vivo phosphorylation data
| Compound Name | KD, Ki or IC50 (nM) | PubChem ID | ChEMBL ID | PubMed ID |
|---|
Disease Linkage
General Disease Association:
Neurological disorders
Specific Diseases (Non-cancerous):
Drug psychosis
Comments:
In animal cell culture studies, mouse islet cells lacking EphA5 expression had elevated levels of insulin secretion, however they had decreased responsiveness to glucose. Therefore, EphA5 is implicated in the regulation of glucose homeostasis and metabolic balance. Altered expression of EphA5 has been associated with drug psychosis, specifically in rodent models. In animal studies, a single injection of methamphetamine into the brain of rats lead to significant changes in EphA5 mRNA expression in the medial frontal cortex, cingulate cortex, piriform cortex, hippocampus, habenular nucleus, and amygdala. Thus changes in EphA5 expression may be responsible for methamphetamine-induced brain disorders, such as drug psychosis. Drug psychosis is a neurological disease resulting from the abusive use of stimulant drugs. The primary causative agents of drug psychosis are amphetamines and cocaine. The symptoms of drug psychosis are similar to those of organic psychosis, including hallucinations, delusions, disordered thoughts and catatonia. During disease progression or during acute overdose of stimulant drugs additional symptoms may be present, including aggression, arrhythmia, dilated pupils, hypertension, hyperthermia, nausea, increased breathing rate, seizures, temor, vomiting, and sleep derivation.
Gene Expression in Cancers:
TranscriptoNET (www.transcriptonet.ca) analysis with mRNA expression data retrieved from the National Center for Biotechnology Information's Gene Expression Omnibus (GEO) database, which was normalized against 60 abundantly and commonly found proteins, indicated altered expression for this protein kinase as shown here as the percent change from normal tissue controls (%CFC) as supported with the Student T-test in the following types of human cancers: Bladder carcinomas (%CFC= -57, p<0.01); Brain glioblastomas (%CFC= -92, p<0.0001); Brain oligodendrogliomas (%CFC= -80, p<0.0001); and Cervical cancer stage 2A (%CFC= -51, p<0.032); and Malignant pleural mesotheliomas (MPM) tumours (%CFC= -63, p<0.02). The COSMIC website notes an up-regulated expression score for EPHA5 in diverse human cancers of 274, which is 0.6-fold of the average score of 462 for the human protein kinases. The down-regulated expression score of 0 for this protein kinase in human cancers was 100% lower than the average score of 60 for the human protein kinases.
Mutagenesis Experiments:
Insertional mutagenesis studies in mice have not yet revealed a role for this protein kinase in mouse cancer oncogenesis.
Mutation Rate in All Cancers:
Percent mutation rates per 100 amino acids length in human cancers: 0.18 % in 25485 diverse cancer specimens. This rate is 2.4-fold higher than the average rate of 0.075 % calculated for human protein kinases in general.
Mutation Rate in Specific Cancers:
Highest percent mutation rates per 100 amino acids length in human cancers: 0.79 % in 1093 large intestine cancers tested; 0.62 % in 589 stomach cancers tested; 0.57 % in 1993 lung cancers tested; 0.38 % in 602 endometrium cancers tested; 0.37 % in 805 skin cancers tested; 0.33 % in 605 oesophagus cancers tested; 0.19 % in 1270 liver cancers tested; 0.1 % in 1962 central nervous system cancers tested; 0.09 % in 1226 kidney cancers tested; 0.09 % in 1195 pancreas cancers tested; 0.08 % in 1488 breast cancers tested.
Frequency of Mutated Sites:
None > 9 in 20,704 cancer specimens
Comments:
Only 2 deletions, 2 insertions, and 3 complex mutations are noted on the COSMIC website.