• KinATLAS
  • TranscriptoNET
  • PhosphoNET
  • OncoNET
  • KinaseNET
  • DrugKiNET
  • DrugProNET
  • KiNET-AM
  • Kinetica Online

Updated November 2019

Home | Kinexus | Contact | Credits

Nomenclature

Short Name:
EPHA6
Full Name:
Ephrin type-A receptor 6 [partial]
Alias:
  • EC 2.7.10.1
  • EHK2
  • FLJ35246
  • DKFZp434C1418; PRO57066; Tyrosine-protein kinase receptor EHK-2
  • EPH homology kinase 2
  • Eph homology kinase-2
  • EPH receptor A6
  • Ephrin type-A receptor 6

Classification

Type:
Protein-tyrosine kinase
Group:
TK
Family:
Eph
SubFamily:
NA


Specific Links

Entrez-Gene Entry: 285220
Entrez-Protein Entry: NP_775926
KinBASE Entry: EPHA6
Pfam Entry: Q9UF33
PhosphoNET Entry: Q9UF33
Phosphosite Plus Entry: 7487
UCSD-Nature Entry: A000845
UniProt Entry: Q9UF33

General Links

ClustalW2
GPS-Cuckoo
Human Protein Atlas
Kinase.com
Kinase Research
Kinasource
Kinomer
Netphorest
NetworKIN
Phosida
PhosphoElm
Protein Blast
ScanSite
String

Structure

Mol. Mass (Da):
116,116
# Amino Acids:
1035
# mRNA Isoforms:
3
mRNA Isoforms:
116,379 Da (1036 AA; Q9UF33); 44,466 Da (398 AA; Q9UF33-3); 37,274 Da (334 AA; Q9UF33-2);
4D Structure:
NA
1D Structure:
Retrieve Gene Sequence
Retrieve Full Protein Sequence
Retrieve Catalytic Domain Sequence
 
Subfamily Alignment
subfamily domain
 
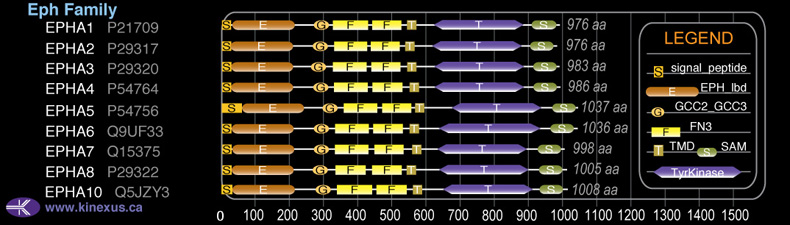
Domain Distribution:
Start End Domain
1 22 signal_peptide
34 207 EPH_lbd
268 312 GCC2_GCC3
330 434 FN3
438 533 FN3
549 571 TMD
631 930 TyrKc
960 1024 SAM
630 943 Pkinase
 

Post-translation Modifications

For detailed information on phosphorylation of this kinase go to PhosphoNET
Acetylated:
K587, K588.
N-GlcNAcylated:
N343, N397, N410.
Serine phosphorylated:

S92, S93, S300, S714, S715, S807, S808, S814, S815, S819, S820.
Threonine phosphorylated:

T88, T89, T663, T664.
Tyrosine phosphorylated:

Y787, Y788, Y793, Y794, Y849, Y850.
 

Distribution

Based on gene microarray analysis from the NCBI
Human Tissue Distribution
% Max Expression:

Mean Expression:

Number of Samples:

Standard Deviation:
% Max Expression:

Mean Expression:

Number of Samples:

Standard Deviation:
  • adipose
    38

    1443

    15

    1235

  • adrenal
    0.3

    13

    2

    7

  • bladder
    -

    -

    -

    -

  • brain
    0.5

    19

    46

    11

  • breast
    10

    380

    17

    180

  • cervix
    0.2

    6

    18

    6

  • colon
    0.1

    5

    20

    4

  • heart
    -

    -

    -

    -

  • intestine
    -

    -

    -

    -

  • kidney
    1

    45

    24

    32

  • liver
    -

    -

    -

    -

  • lung
    11

    419

    23

    409

  • lymphnode
    -

    -

    -

    -

  • ovary
    -

    -

    -

    -

  • pancreas
    -

    -

    -

    -

  • pituitary
    0.1

    5

    10

    5

  • prostate
    0.2

    7

    8

    4

  • salivarygland
    -

    -

    -

    -

  • skeletalmuscle"
    2

    64

    18

    29

  • skin
    10

    394

    51

    180

  • spinalcord
    -

    -

    -

    -

  • spleen
    -

    -

    -

    -

  • stomach
    -

    -

    -

    -

  • testis
    -

    -

    -

    -

  • thymus
    -

    -

    -

    -

  • thyroid
    13

    482

    32

    402

  • tonsil
    -

    -

    -

    -

  • trachea
    -

    -

    -

    -

  • uterus
    -

    -

    -

    -

  • reticulocytes"
    1

    39

    14

    34

  • t-lymphocytes
    -

    -

    -

    -

  • b-lymphocytes
    100

    3830

    22

    5415

  • neutrophils
    2

    63

    53

    208

  • macrophages
    14

    550

    52

    481

  • sperm
    4

    160

    44

    270


Evolution

Species Conservation
PhosphoNET % Identity:
PhosphoNET % Similarity:
Homologene %
Identity:
PhosphoNET % Identity:
PhosphoNET % Similarity:
Homologene %
Identity:
  • tableheader
    100

    100

    100
  • tableheader
    40.2

    58.9

    99
  • tableheader
    98.8

    99.4

    99.5
  • tableheader
    -

    -

    97
  • tableheader
    -

    -

    -
  • tableheader
    87

    89.2

    99
  • tableheader
    -

    -

    -
  • tableheader
    96.6

    98.2

    95
  • tableheader
    95.8

    97.6

    95
  • tableheader
    -

    -

    -
  • tableheader
    89.4

    93

    -
  • tableheader
    61.5

    76.1

    92
  • tableheader
    58.2

    72

    86
  • tableheader
    56.2

    70.3

    79
  • tableheader
    -

    -

    -
  • tableheader
    -

    -

    34
  • tableheader
    -

    -

    -
  • tableheader
    -

    -

    30
  • tableheader
    -

    -

    -
  • tableheader
    -

    -

    -
  • tableheader
    -

    -

    -
  • tableheader
    -

    -

    -
  • tableheader
    -

    -

    -
  • tableheader
    -

    -

    -
  • tableheader
    -

    -

    -
For a wider analysis go to PhosphoNET Evolution in PhosphoNET
 

Binding Proteins

Examples of known interacting proteins
hiddentext
No. Name – UniProt ID
1 MLLT4 - P55196
 

Regulation

Activation:
Activated by binding ephrin-A1, A2, A3, A4 or A5.
Inhibition:
NA
Synthesis:
NA
Degradation:
NA
 

Kinections Map

Click here to download a PPT of the image below
 
Kinections GIF
 

Protein Kinase Specificity

Matrix of observed frequency (%) of amino acids in aligned protein substrate phosphosites

Kinections GIF
Matrix Type:
Predicted from the application of the Kinexus Kinase Substrate Predictor Version 2.0 algorithm, which was trained with over 10,000 kinase-protein substrate pairs and 8,000 kinase-peptide substrate pairs.
Domain #:
1
 

Inhibitors

For further details on these inhibitors click on the Compound Name and enter it into DrugKiNET or click on the ID's
Based on in vitro and/or in vivo phosphorylation data
Compound Name KD, Ki or IC50 (nM) PubChem ID ChEMBL ID PubMed ID
Foretinib Kd = 1.1 nM 42642645 1230609 22037378
Hesperadin Kd < 10 nM 10142586 514409 19035792
CHEMBL249097 Kd = 20 nM 25138012 249097 19035792
Bosutinib IC50 < 25 nM 5328940 288441 22037377
Cediranib Kd = 36 nM 9933475 491473 22037378
PP1 Analog II; 1NM-PP1 IC50 > 50 nM 5154691 573578 22037377
Vandetanib Kd = 50 nM 3081361 24828 18183025
Crizotinib Kd = 65 nM 11626560 601719 22037378
Canertinib Kd = 72 nM 156414 31965 15711537
NVP-TAE684 Kd = 120 nM 16038120 509032 22037378
R406 Kd = 120 nM 11984591 22037378
AG1478 IC50 > 150 nM 2051 7917 22037377
SU11274 IC50 > 150 nM 9549297 261641 22037377
Brivanib Kd = 190 nM 11234052 377300 22037378
Sorafenib Kd = 240 nM 216239 1336 15711537
Staurosporine Kd = 240 nM 5279 15711537
Erlotinib IC50 > 250 nM 176870 553 22037377
Ki11502 IC50 > 250 nM 22037377
Syk Inhibitor IC50 > 250 nM 6419747 104279 22037377
Linifanib Kd = 330 nM 11485656 223360 18183025
Afatinib Kd = 340 nM 10184653 1173655 22037378
AST-487 Kd = 380 nM 11409972 574738 18183025
Doramapimod Kd = 430 nM 156422 103667 15711537
Motesanib Kd = 490 nM 11667893 572881 18183025
Dasatinib IC50 = 500 nM 11153014 1421 22037377
Dovitinib IC50 = 500 nM 57336746 22037377
MNK1 Inhibitor IC50 = 500 nM 11644425 1240885 22037377
Nilotinib IC50 = 500 nM 644241 255863 22037377
PKR Inhibitor IC50 = 500 nM 6490494 235641 22037377
SU11652 IC50 = 500 nM 24906267 13485 22037377
Tozasertib IC50 = 500 nM 5494449 572878 22037377
MLN8054 Kd = 580 nM 11712649 259084 18183025
Gefitinib Kd = 590 nM 123631 939 18183025
Nintedanib Kd = 940 nM 9809715 502835 22037378
Sunitinib Kd = 960 nM 5329102 535 18183025
K-252a; Nocardiopsis sp. IC50 > 1 µM 3813 281948 22037377
Lck Inhibitor IC50 > 1 µM 6603792 22037377
p38 MAP Kinase Inhibitor IC50 > 1 µM 4665 91730 22037377
PD169316 IC50 > 1 µM 4712 17331 22037377
PKCbII/EGFR Inhibitor IC50 > 1 µM 6711154 22037377
SB218078 IC50 > 1 µM 447446 289422 22037377
Src Kinase Inhibitor I IC50 > 1 µM 1474853 97771 22037377
SU6656 IC50 > 1 µM 5353978 605003 22037377
WZ3146 Kd > 1 µM 44607360 20033049
WZ4002 Kd > 1 µM 44607530 20033049
Lestaurtinib Kd = 1.2 µM 126565 22037378
SB203580 Kd = 1.2 µM 176155 10 18183025
SureCN5632345 Kd < 1.25 µM 44593646 515466 19035792
KW2449 Kd = 1.5 µM 11427553 1908397 22037378
RAF265 Kd = 1.5 µM 11656518 558752 18183025
SU14813 Kd = 2 µM 10138259 1721885 18183025
SB202190 Kd = 2.2 µM 5353940 278041 18183025
TG101348 Kd = 3.9 µM 16722836 1287853 22037378
BMS-690514 Kd < 4 µM 11349170 21531814
Pelitinib Kd = 4.1 µM 6445562 607707 15711537
 

Disease Linkage

Gene Expression in Cancers:

The COSMIC website notes an up-regulated expression score for EPHA6 in diverse human cancers of 438, which is close to the average score of 462 for the human protein kinases. The down-regulated expression score of 0 for this protein kinase in human cancers was 100% lower than the average score of 60 for the human protein kinases.
Mutagenesis Experiments:

Insertional mutagenesis studies in mice have not yet revealed a role for this protein kinase in mouse cancer oncogenesis.
Mutation Rate in All Cancers:

Percent mutation rates per 100 amino acids length in human cancers: 0.14 % in 25741 diverse cancer specimens. This rate is 1.9-fold higher than the average rate of 0.075 % calculated for human protein kinases in general.
Mutation Rate in Specific Cancers:

Highest percent mutation rates per 100 amino acids length in human cancers: 0.98 % in 913 skin cancers tested; 0.44 % in 1259 large intestine cancers tested; 0.4 % in 629 stomach cancers tested; 0.37 % in 1956 lung cancers tested; 0.29 % in 710 oesophagus cancers tested; 0.25 % in 152 biliary tract cancers tested; 0.21 % in 603 endometrium cancers tested; 0.16 % in 1512 liver cancers tested.
Frequency of Mutated Sites:

Most frequent mutations with the number of reports indicated in brackets: R174C (9); R165C (3); R88C (3).
Comments:
Only 1 deletion, 2 insertions and no complex mutations are noted on the COSMIC website.
 
COSMIC Entry:
EPHA6
OMIM Entry:
600066
  • Home
  • Top of Page
Copyright 2019 Kinexus BioInformatics Corporation