
Nomenclature
Short Name:
EPHA7
Full Name:
Ephrin type-A receptor 7
Alias:
- Developmental kinase 1
- EBK
- EPA7
- EPH homology kinase 3
- EPH homology kinase-3
- Tyrosine-protein kinase receptor EHK-3
- EC 2.7.10.1
- EHK3
- EHK-3
- Embryonic brain kinase
Classification
Type:
Protein-tyrosine kinase
Group:
TK
Family:
Eph
SubFamily:
NA

Structure
Mol. Mass (Da):
112097
# Amino Acids:
998
# mRNA Isoforms:
5
mRNA Isoforms:
112,097 Da (998 AA; Q15375); 111,623 Da (994 AA; Q15375-4); 111,504 Da (993 AA; Q15375-2); 50,521 Da (449 AA; Q15375-5); 31,833 Da (279 AA; Q15375-3
4D Structure:
Interacts with PRKCABP and GRIP1
1D Structure:
3D Image (rendered using PV Viewer):
PDB ID
Subfamily Alignment
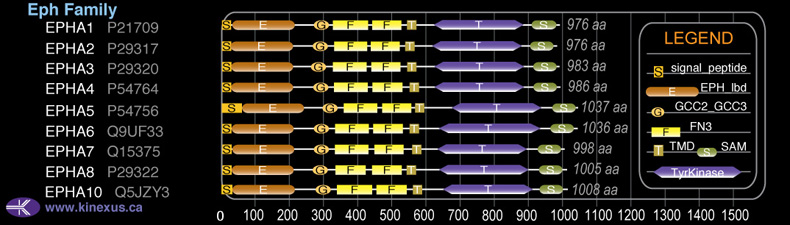
Domain Distribution:
Post-translation Modifications
For detailed information on phosphorylation of this kinase go to PhosphoNET
Acetylated:
K653.
N-GlcNAcylated:
N343, N410.
Serine phosphorylated:
S91, S307, S308, S501, S768, S775, S780.
Threonine phosphorylated:
T87, T607, T613, T666, T792, T794.
Tyrosine phosphorylated:
Y201, Y202, Y597, Y608, Y614, Y671, Y748, Y754, Y791, Y810-.
Ubiquitinated:
K601, K668, K892.
Distribution
Based on gene microarray analysis from the NCBI
Human Tissue Distribution
% Max Expression:
Mean Expression:
Number of Samples:
Standard Deviation:
% Max Expression:
Mean Expression:
Number of Samples:
Standard Deviation:
 100
100
983
34
1258
 0.7
0.7
7
11
9
 10
10
101
17
187
 10
10
101
134
165
 38
38
376
41
257
 0.4
0.4
4
64
4
 6
6
58
49
162
 17
17
169
35
286
 26
26
251
10
254
 9
9
91
95
119
 3
3
25
26
61
 34
34
333
130
367
 3
3
32
28
115
 0.5
0.5
5
7
7
 4
4
41
27
98
 0.6
0.6
6
22
4
 11
11
112
190
508
 39
39
380
22
1468
 2
2
23
95
36
 34
34
339
135
247
 5
5
47
29
96
 7
7
72
31
142
 6
6
57
26
150
 4
4
36
23
106
 5
5
46
28
183
 52
52
509
88
1532
 3
3
26
26
87
 51
51
505
22
2144
 5
5
47
22
157
 15
15
143
42
120
 33
33
321
18
233
 26
26
256
36
413
 4
4
43
75
168
 63
63
623
109
582
 5
5
45
61
30
Evolution
Species Conservation
PhosphoNET % Identity:
PhosphoNET % Similarity:
Homologene %
Identity:
PhosphoNET % Identity:
PhosphoNET % Similarity:
Homologene %
Identity:
 100
100
100
100 41.4
41.4
62.5
100 64.4
64.4
79.5
- -
-
-
98 -
-
-
- 99.7
99.7
100
100 -
-
-
- 97.9
97.9
99.5
98 98.7
98.7
99.6
99 -
-
-
- 96.7
96.7
98.5
- 97.5
97.5
98.5
98 64.3
64.3
78.1
92.5 60.5
60.5
75.3
88 -
-
-
- -
-
-
- -
-
-
- -
-
-
33 -
-
-
- -
-
-
- -
-
-
- -
-
-
- -
-
-
- -
-
-
- -
-
-
-
For a wider analysis go to PhosphoNET Evolution in PhosphoNET
Binding Proteins
Examples of known interacting proteins
hiddentext
| No. | Name – UniProt ID |
|---|---|
| 1 | MLLT4 - P55196 |
| 2 | EFNA2 - O43921 |
Regulation
Activation:
Activated by binding ephrin-A1, A2, A3, A4 or A5, which induces dimerization and autophosphorylation.
Inhibition:
NA
Synthesis:
NA
Degradation:
NA
Protein Kinase Specificity
Matrix of observed frequency (%) of amino acids in aligned protein substrate phosphosites
Matrix Type:
Predicted from the application of the Kinexus Kinase Substrate Predictor Version 2.0 algorithm, which was trained with over 10,000 kinase-protein substrate pairs and 8,000 kinase-peptide substrate pairs.
Domain #:
1
Inhibitors
For further details on these inhibitors click on the Compound Name and enter it into DrugKiNET or click on the ID's
Based on in vitro and/or in vivo phosphorylation data
| Compound Name | KD, Ki or IC50 (nM) | PubChem ID | ChEMBL ID | PubMed ID |
|---|
Disease Linkage
General Disease Association:
Cancer, bone disorders
Specific Diseases (Non-cancerous):
Brachydactyly-Syndactyly syndrome
Specific Cancer Types:
Gallbladder adenocarcinomas
Comments:
The D6S1056 microsatellite marker within the EphA7 gene is deleted in prostate cancers, and it is feasible that deletion and/or promoter CpG hypermethylation could contribute to EphA7 declines in human tumours.
Gene Expression in Cancers:
TranscriptoNET (www.transcriptonet.ca) analysis with mRNA expression data retrieved from the National Center for Biotechnology Information's Gene Expression Omnibus (GEO) database, which was normalized against 60 abundantly and commonly found proteins, indicated altered expression for this protein kinase as shown here as the percent change from normal tissue controls (%CFC) as supported with the Student T-test in the following types of human cancers: Breast epithelial carcinomas (%CFC= -76, p<0.012); Clear cell renal cell carcinomas (cRCC) stage I (%CFC= +690, p<0.003); Malignant pleural mesotheliomas (MPM) tumours (%CFC= -63, p<0.015); Prostate cancer - metastatic (%CFC= -82, p<0.0001); and Prostate cancer - primary (%CFC= +66, p<0.0002). The COSMIC website notes an up-regulated expression score for EPHA7 in diverse human cancers of 301, which is 0.7-fold of the average score of 462 for the human protein kinases. The down-regulated expression score of 0 for this protein kinase in human cancers was 100% lower than the average score of 60 for the human protein kinases.
Mutagenesis Experiments:
Insertional mutagenesis studies in mice have not yet revealed a role for this protein kinase in mouse cancer oncogenesis.
Mutation Rate in All Cancers:
Percent mutation rates per 100 amino acids length in human cancers: 0.16 % in 25981 diverse cancer specimens. This rate is 2.2-fold higher than the average rate of 0.075 % calculated for human protein kinases in general.
Mutation Rate in Specific Cancers:
Highest percent mutation rates per 100 amino acids length in human cancers: 0.98 % in 805 skin cancers tested; 0.63 % in 1119 large intestine cancers tested; 0.31 % in 1943 lung cancers tested; 0.27 % in 589 stomach cancers tested; 0.23 % in 605 oesophagus cancers tested; 0.23 % in 1270 liver cancers tested; 0.22 % in 602 endometrium cancers tested; 0.21 % in 968 upper aerodigestive tract cancers tested; 0.08 % in 2217 haematopoietic and lymphoid cancers tested; 0.05 % in 1962 central nervous system cancers tested.
Frequency of Mutated Sites:
None > 8 in 20,995 cancer specimens
Comments:
Broad distribution of point mutations, 7 deletions, 4 insertions, and 3 complex mutations are noted on the COSMIC website.