
Nomenclature
Short Name:
EPHB1
Full Name:
Ephrin type-B receptor 1
Alias:
- EC 2.7.10.1
- EPTH2
- HEK6
- Kinase EphB1
- CEK6; Tyrosine-protein kinase receptor EPH-2; AW488255
- ELK
- EPB1
- Eph receptor B1
- EPH2
- EPHT2
Classification
Type:
Protein-tyrosine kinase
Group:
TK
Family:
Eph
SubFamily:
NA

Specific Links
Structure
Mol. Mass (Da):
109,885
# Amino Acids:
984
# mRNA Isoforms:
3
mRNA Isoforms:
109,885 Da (984 AA; P54762); 61,401 Da (545 AA; P54762-5); 26,906 Da (242 AA; P54762-6)
4D Structure:
The ligand-activated form interacts with GRB2, GRB10 and NCK through their respective SH2 domains. The GRB10 SH2 domain binds EPHB1 through Tyr-928, while GRB2 binds residues within the catalytic domain. Interacts with EPHB6. The NCK SH2 domain binds EPHB1 through Tyr-594. Interacts with PRKCABP
1D Structure:
3D Image (rendered using PV Viewer):
PDB ID
Subfamily Alignment
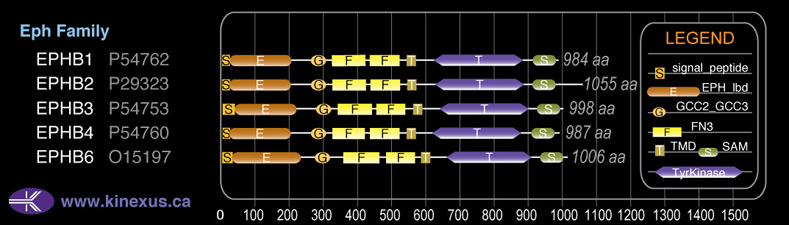
Domain Distribution:
Kinexus Products
Click on entries below for direct links to relevant products from Kinexus for this protein kinase.
hiddentext
Post-translation Modifications
For detailed information on phosphorylation of this kinase go to PhosphoNET
N-GlcNAcylated:
N334, N426, N480.
Serine phosphorylated:
S164, S395, S583, S588, S754, S761, S766, S774, S968, S979.
Threonine phosphorylated:
T599, T777, T981.
Tyrosine phosphorylated:
Y575, Y582, Y594+, Y600, Y634, Y740, Y768, Y778, Y798, Y928.
Ubiquitinated:
K592.
Distribution
Based on gene microarray analysis from the NCBI
Human Tissue Distribution
% Max Expression:
Mean Expression:
Number of Samples:
Standard Deviation:
% Max Expression:
Mean Expression:
Number of Samples:
Standard Deviation:
 65
65
859
38
1356
 2
2
30
14
47
 22
22
285
16
557
 18
18
243
139
401
 29
29
379
35
337
 19
19
251
90
922
 12
12
153
41
452
 100
100
1320
48
3677
 16
16
208
17
164
 5
5
63
95
103
 8
8
101
34
246
 43
43
561
173
562
 7
7
92
39
214
 2
2
24
12
31
 16
16
211
27
621
 0.8
0.8
10
20
17
 18
18
231
129
2046
 65
65
863
24
3280
 7
7
92
110
253
 30
30
393
137
452
 9
9
124
28
253
 8
8
107
30
238
 9
9
116
27
222
 12
12
159
26
275
 12
12
161
28
402
 43
43
564
95
850
 6
6
78
40
190
 30
30
397
24
945
 8
8
100
26
193
 14
14
186
42
152
 25
25
331
24
343
 36
36
481
41
592
 43
43
561
85
855
 49
49
649
83
601
 9
9
121
48
111
Evolution
Species Conservation
PhosphoNET % Identity:
PhosphoNET % Similarity:
Homologene %
Identity:
PhosphoNET % Identity:
PhosphoNET % Similarity:
Homologene %
Identity:
 100
100
100
100 48.1
48.1
65.2
100 99.7
99.7
99.9
100 -
-
-
99 -
-
-
- 95.7
95.7
96.8
99 -
-
-
- 98.9
98.9
99.6
99 98.9
98.9
99.6
99 -
-
-
- -
-
-
- 89.3
89.3
92.8
95 88.9
88.9
93.2
92 55.9
55.9
73.1
87 -
-
-
- -
-
-
47 -
-
-
- -
-
-
- -
-
-
- -
-
-
- -
-
-
- -
-
-
- -
-
-
- -
-
-
- -
-
-
-
For a wider analysis go to PhosphoNET Evolution in PhosphoNET
Binding Proteins
Examples of known interacting proteins
hiddentext
| No. | Name – UniProt ID |
|---|---|
| 1 | EFNB1 - P98172 |
| 2 | EFNB2 - P52799 |
| 3 | EPHB6 - O15197 |
| 4 | ACP1 - P24666 |
| 5 | GRB7 - Q14451 |
| 6 | PXN - P49023 |
| 7 | NCK1 - P16333 |
| 8 | PDGFRB - P09619 |
Regulation
Activation:
Activated by binding ephrin-B1, B2, or B3. Phosphorylation at Tyr-594 induces interaction with Nck1. Phosphorylation at Tyr-928 induces interaction with Grb2 and Grb7.
Inhibition:
NA
Synthesis:
NA
Degradation:
(EFNB1)ligand-induced poly- and/or multi-ubiquitination by CBL is regulated by SRC and leads to lysosomal degradation.
Known Downstream Substrates
For further details on these substrates click on the Substrate Short Name or UniProt ID. Phosphosite Location is hyperlinked to PhosphoNET
predictions.
Based on in vitro and/or in vivo phosphorylation data
| Substrate Short Name | UniProt ID (Human) | Phosphosite Location | Phosphosite Sequence | Effect of Phosphorylation |
|---|
Protein Kinase Specificity
Matrix of observed frequency (%) of amino acids in aligned protein substrate phosphosites
Matrix Type:
Experimentally derived from alignment of 3 known protein substrate phosphosites and 44 peptides phosphorylated by recombinant EphB1 in vitro tested in-house by Kinexus.
Domain #:
1
Inhibitors
For further details on these inhibitors click on the Compound Name and enter it into DrugKiNET or click on the ID's
Based on in vitro and/or in vivo phosphorylation data
| Compound Name | KD, Ki or IC50 (nM) | PubChem ID | ChEMBL ID | PubMed ID |
|---|
Disease Linkage
General Disease Association:
Cancer
Specific Cancer Types:
Gastric cancer
Gene Expression in Cancers:
TranscriptoNET (www.transcriptonet.ca) analysis with mRNA expression data retrieved from the National Center for Biotechnology Information's Gene Expression Omnibus (GEO) database, which was normalized against 60 abundantly and commonly found proteins, indicated altered expression for this protein kinase as shown here as the percent change from normal tissue controls (%CFC) as supported with the Student T-test in the following types of human cancers: Brain glioblastomas (%CFC= +297, p<0.012); Breast epithelial carcinomas (%CFC= -62, p<0.024); Breast epithelial hyperplastic enlarged lobular units (HELU) (%CFC= -59, p<0.017); Cervical cancer stage 2A (%CFC= +65, p<0.077); Classical Hodgkin lymphomas (%CFC= +55, p<0.002); Clear cell renal cell carcinomas (cRCC) stage (%CFC= +162, p<0.004); and Skin fibrosarcomas (%CFC= +327, p<0.043). The COSMIC website notes an up-regulated expression score for EPHB1 in diverse human cancers of 465, which is close to the average score of 462 for the human protein kinases. The down-regulated expression score of 0 for this protein kinase in human cancers was 100% lower than average score of 60 for the human protein kinases.
Mutagenesis Experiments:
Insertional mutagenesis studies in mice have not yet revealed a role for this protein kinase in mouse cancer oncogenesis. NCK1 interaction with EphB1 can be inhibited with an Y594F mutation. Interaction with SHC1 and Src are inhibited with an Y600F mutation, whereas inhibited interaction with just SHC1 occurs with an Y778F mutation. Autophosphorylation of EphB1 and CBL-mediated ubiquitination is inhibited with a K651R mutation. The SH2 domain of GRB10 does not bind EphB1 with an Y928F mutation.
Mutation Rate in All Cancers:
Percent mutation rates per 100 amino acids length in human cancers: 0.17 % in 25767 diverse cancer specimens. This rate is 2.2-fold higher than the average rate of 0.075 % calculated for human protein kinases in general.
Mutation Rate in Specific Cancers:
Highest percent mutation rates per 100 amino acids length in human cancers: 0.7 % in 1353 large intestine cancers tested; 0.66 % in 944 skin cancers tested; 0.42 % in 629 stomach cancers tested; 0.39 % in 603 endometrium cancers tested; 0.38 % in 1956 lung cancers tested; 0.24 % in 710 oesophagus cancers tested; 0.17 % in 548 urinary tract cancers tested; 0.15 % in 1467 pancreas cancers tested; 0.14 % in 891 ovary cancers tested; 0.1 % in 939 prostate cancers tested; 0.1 % in 1096 upper aerodigestive tract cancers tested; 0.07 % in 1512 liver cancers tested.
Frequency of Mutated Sites:
Most frequent mutations with the number of reports indicated in brackets: V332I (7); T387M (5); R79W (4); R390C (3); S761P (3).
Comments:
Only 5 deletions, 1 insertion and no complex mutations are noted on the COSMIC website.