
Nomenclature
Short Name:
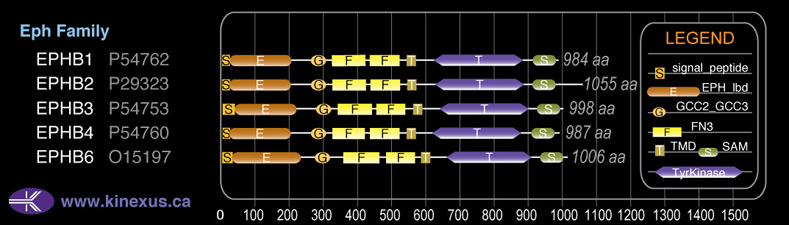
EPHB3
Full Name:
Ephrin type-B receptor 3
Alias:
- Developmental kinase 5
- Kinase EphB3
- MDK5
- SEK4
- CEK10; TYRO6; Tyrosine-protein kinase receptor MDK-5
- EC 2.7.10.1
- EPH receptor B3
- Ephrin type-B receptor 3
- ETK2
- HEK2
Classification
Type:
Protein-tyrosine kinase
Group:
TK
Family:
Eph
SubFamily:
NA

Specific Links
Structure
Mol. Mass (Da):
110,330
# Amino Acids:
998
# mRNA Isoforms:
1
mRNA Isoforms:
110,330 Da (998 AA; P54753)
4D Structure:
NA
1D Structure:
3D Image (rendered using PV Viewer):
PDB ID
Subfamily Alignment
Domain Distribution:
Kinexus Products
Click on entries below for direct links to relevant products from Kinexus for this protein kinase.
hiddentext
Post-translation Modifications
For detailed information on phosphorylation of this kinase go to PhosphoNET
Acetylated:
K747.
N-GlcNAcylated:
N351, N445.
Serine phosphorylated:
S167, S201, S204, S249, S413, S768, S775, S780, S794, S795, S901.
Threonine phosphorylated:
T448, T458, T594, T613, T731, T791, T971.
Tyrosine phosphorylated:
Y593, Y600, Y608, Y614, Y671, Y754, Y792, Y812, Y924.
Distribution
Based on gene microarray analysis from the NCBI
Human Tissue Distribution
% Max Expression:
Mean Expression:
Number of Samples:
Standard Deviation:
% Max Expression:
Mean Expression:
Number of Samples:
Standard Deviation:
 55
55
1257
29
1669
 1
1
28
13
28
 2
2
55
2
9
 14
14
327
80
527
 42
42
948
25
736
 100
100
2265
82
7187
 10
10
218
31
443
 67
67
1512
29
3195
 19
19
436
17
408
 3
3
78
71
88
 2
2
49
19
63
 32
32
721
153
675
 2
2
34
24
13
 2
2
55
12
30
 4
4
96
15
60
 1
1
26
15
15
 4
4
99
112
362
 6
6
143
11
112
 2
2
43
77
38
 31
31
711
109
682
 3
3
67
13
79
 1
1
23
15
19
 12
12
263
12
110
 3
3
66
9
78
 1
1
26
13
21
 55
55
1245
45
2623
 2
2
55
27
24
 6
6
138
11
60
 3
3
65
11
38
 6
6
133
28
84
 15
15
336
24
326
 58
58
1323
36
2943
 3
3
67
64
266
 32
32
720
57
675
 6
6
139
35
168
Evolution
Species Conservation
PhosphoNET % Identity:
PhosphoNET % Similarity:
Homologene %
Identity:
PhosphoNET % Identity:
PhosphoNET % Similarity:
Homologene %
Identity:
 100
100
100
100 47.4
47.4
63.5
100 97.7
97.7
98.3
100 -
-
-
99 -
-
-
99 85.7
85.7
86.2
99 -
-
-
- 96
96
96.8
97 70.2
70.2
81.7
97 -
-
-
- -
-
-
- 83.4
83.4
90.7
87 77.5
77.5
87.6
80 54.7
54.7
69
83 -
-
-
- -
-
-
- -
-
-
- -
-
-
- -
-
-
- -
-
-
- -
-
-
- -
-
-
- -
-
-
- -
-
-
- -
-
-
-
For a wider analysis go to PhosphoNET Evolution in PhosphoNET
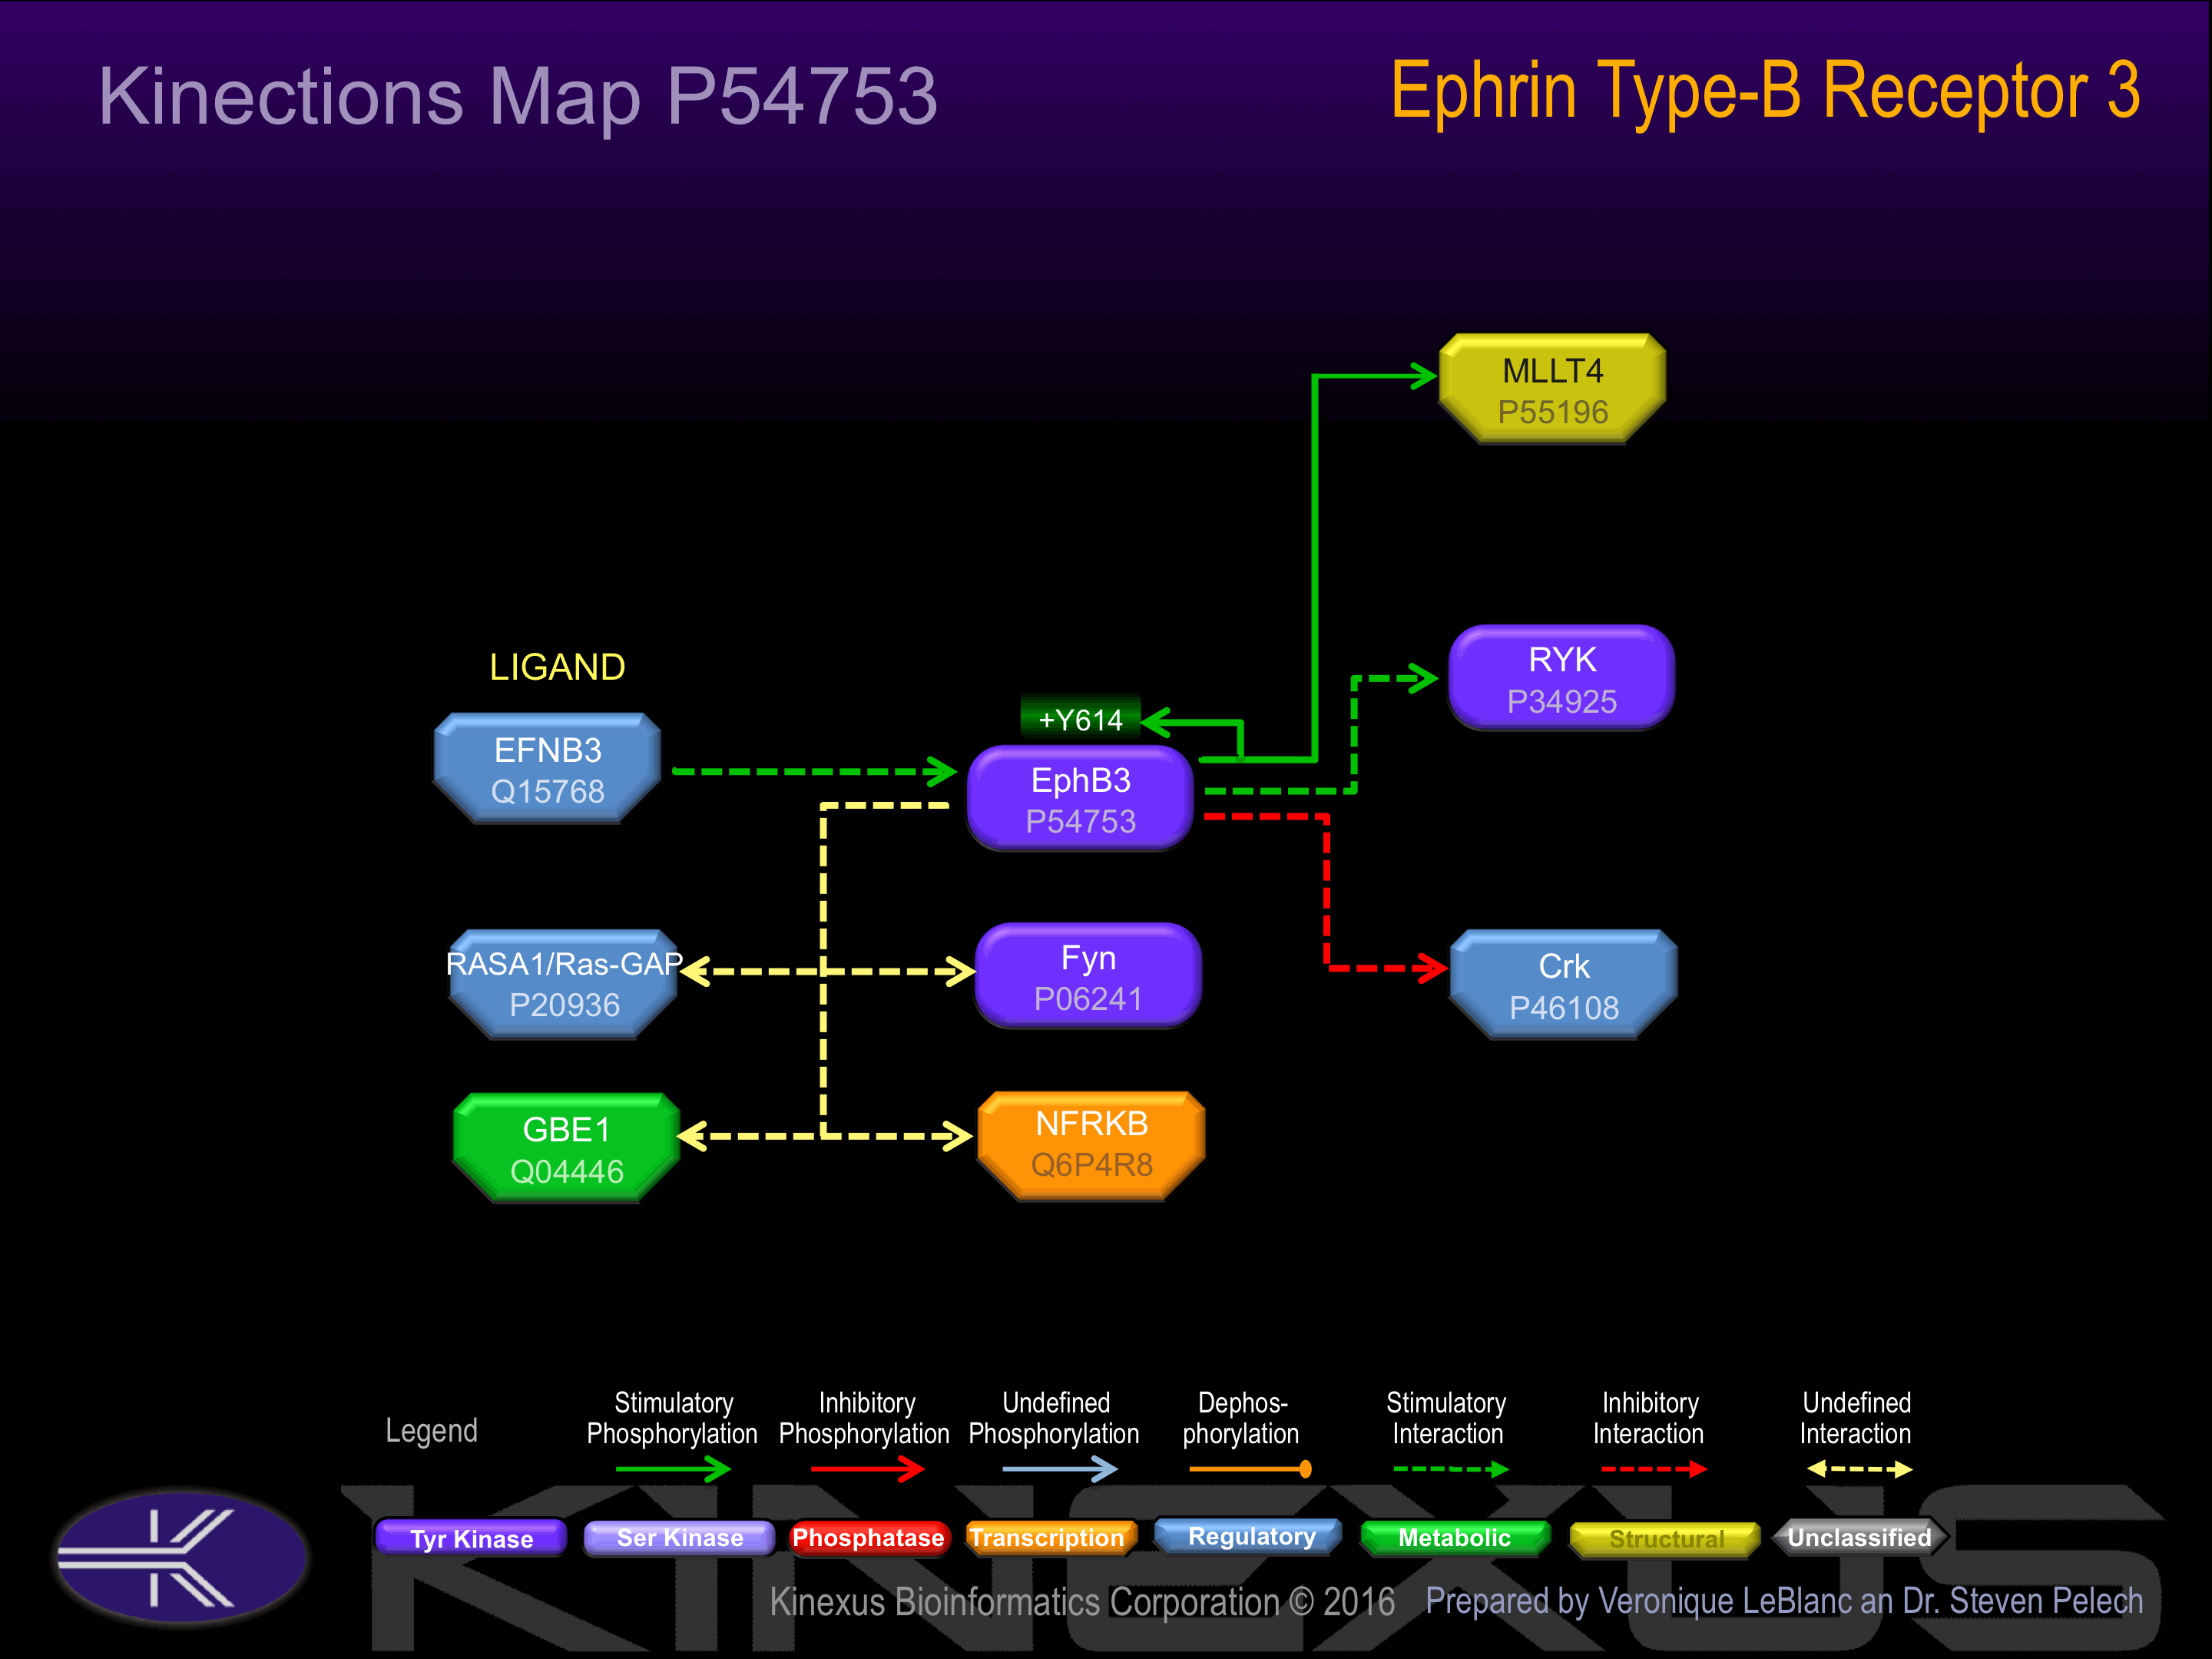
Binding Proteins
Examples of known interacting proteins
hiddentext
| No. | Name – UniProt ID |
|---|---|
| 1 | MLLT4 - P55196 |
| 2 | EFNB3 - Q15768 |
| 3 | RYK - P34925 |
| 4 | CRK - P46108 |
Regulation
Activation:
Activated by binding ephrin-B1, B2, or B3. Phosphorylation at Tyr-614 induces interaction with Crk, Fyn, and RasGAP.
Inhibition:
NA
Synthesis:
NA
Degradation:
NA
Known Upstream Kinases
For further details on these substrates click on the Substrate Short Name or UniProt ID. Phosphosite Location is hyperlinked to PhosphoNET
predictions.
Based on in vitro and/or in vivo phosphorylation data
| Kinase Short Name | UniProt ID (Human) | Phosphosite Location | Phosphosite Sequence | Effect of Phosphorylation |
|---|
Known Downstream Substrates
For further details on these substrates click on the Substrate Short Name or UniProt ID. Phosphosite Location is hyperlinked to PhosphoNET
predictions.
Based on in vitro and/or in vivo phosphorylation data
| Substrate Short Name | UniProt ID (Human) | Phosphosite Location | Phosphosite Sequence | Effect of Phosphorylation |
|---|
Protein Kinase Specificity
Matrix of observed frequency (%) of amino acids in aligned protein substrate phosphosites
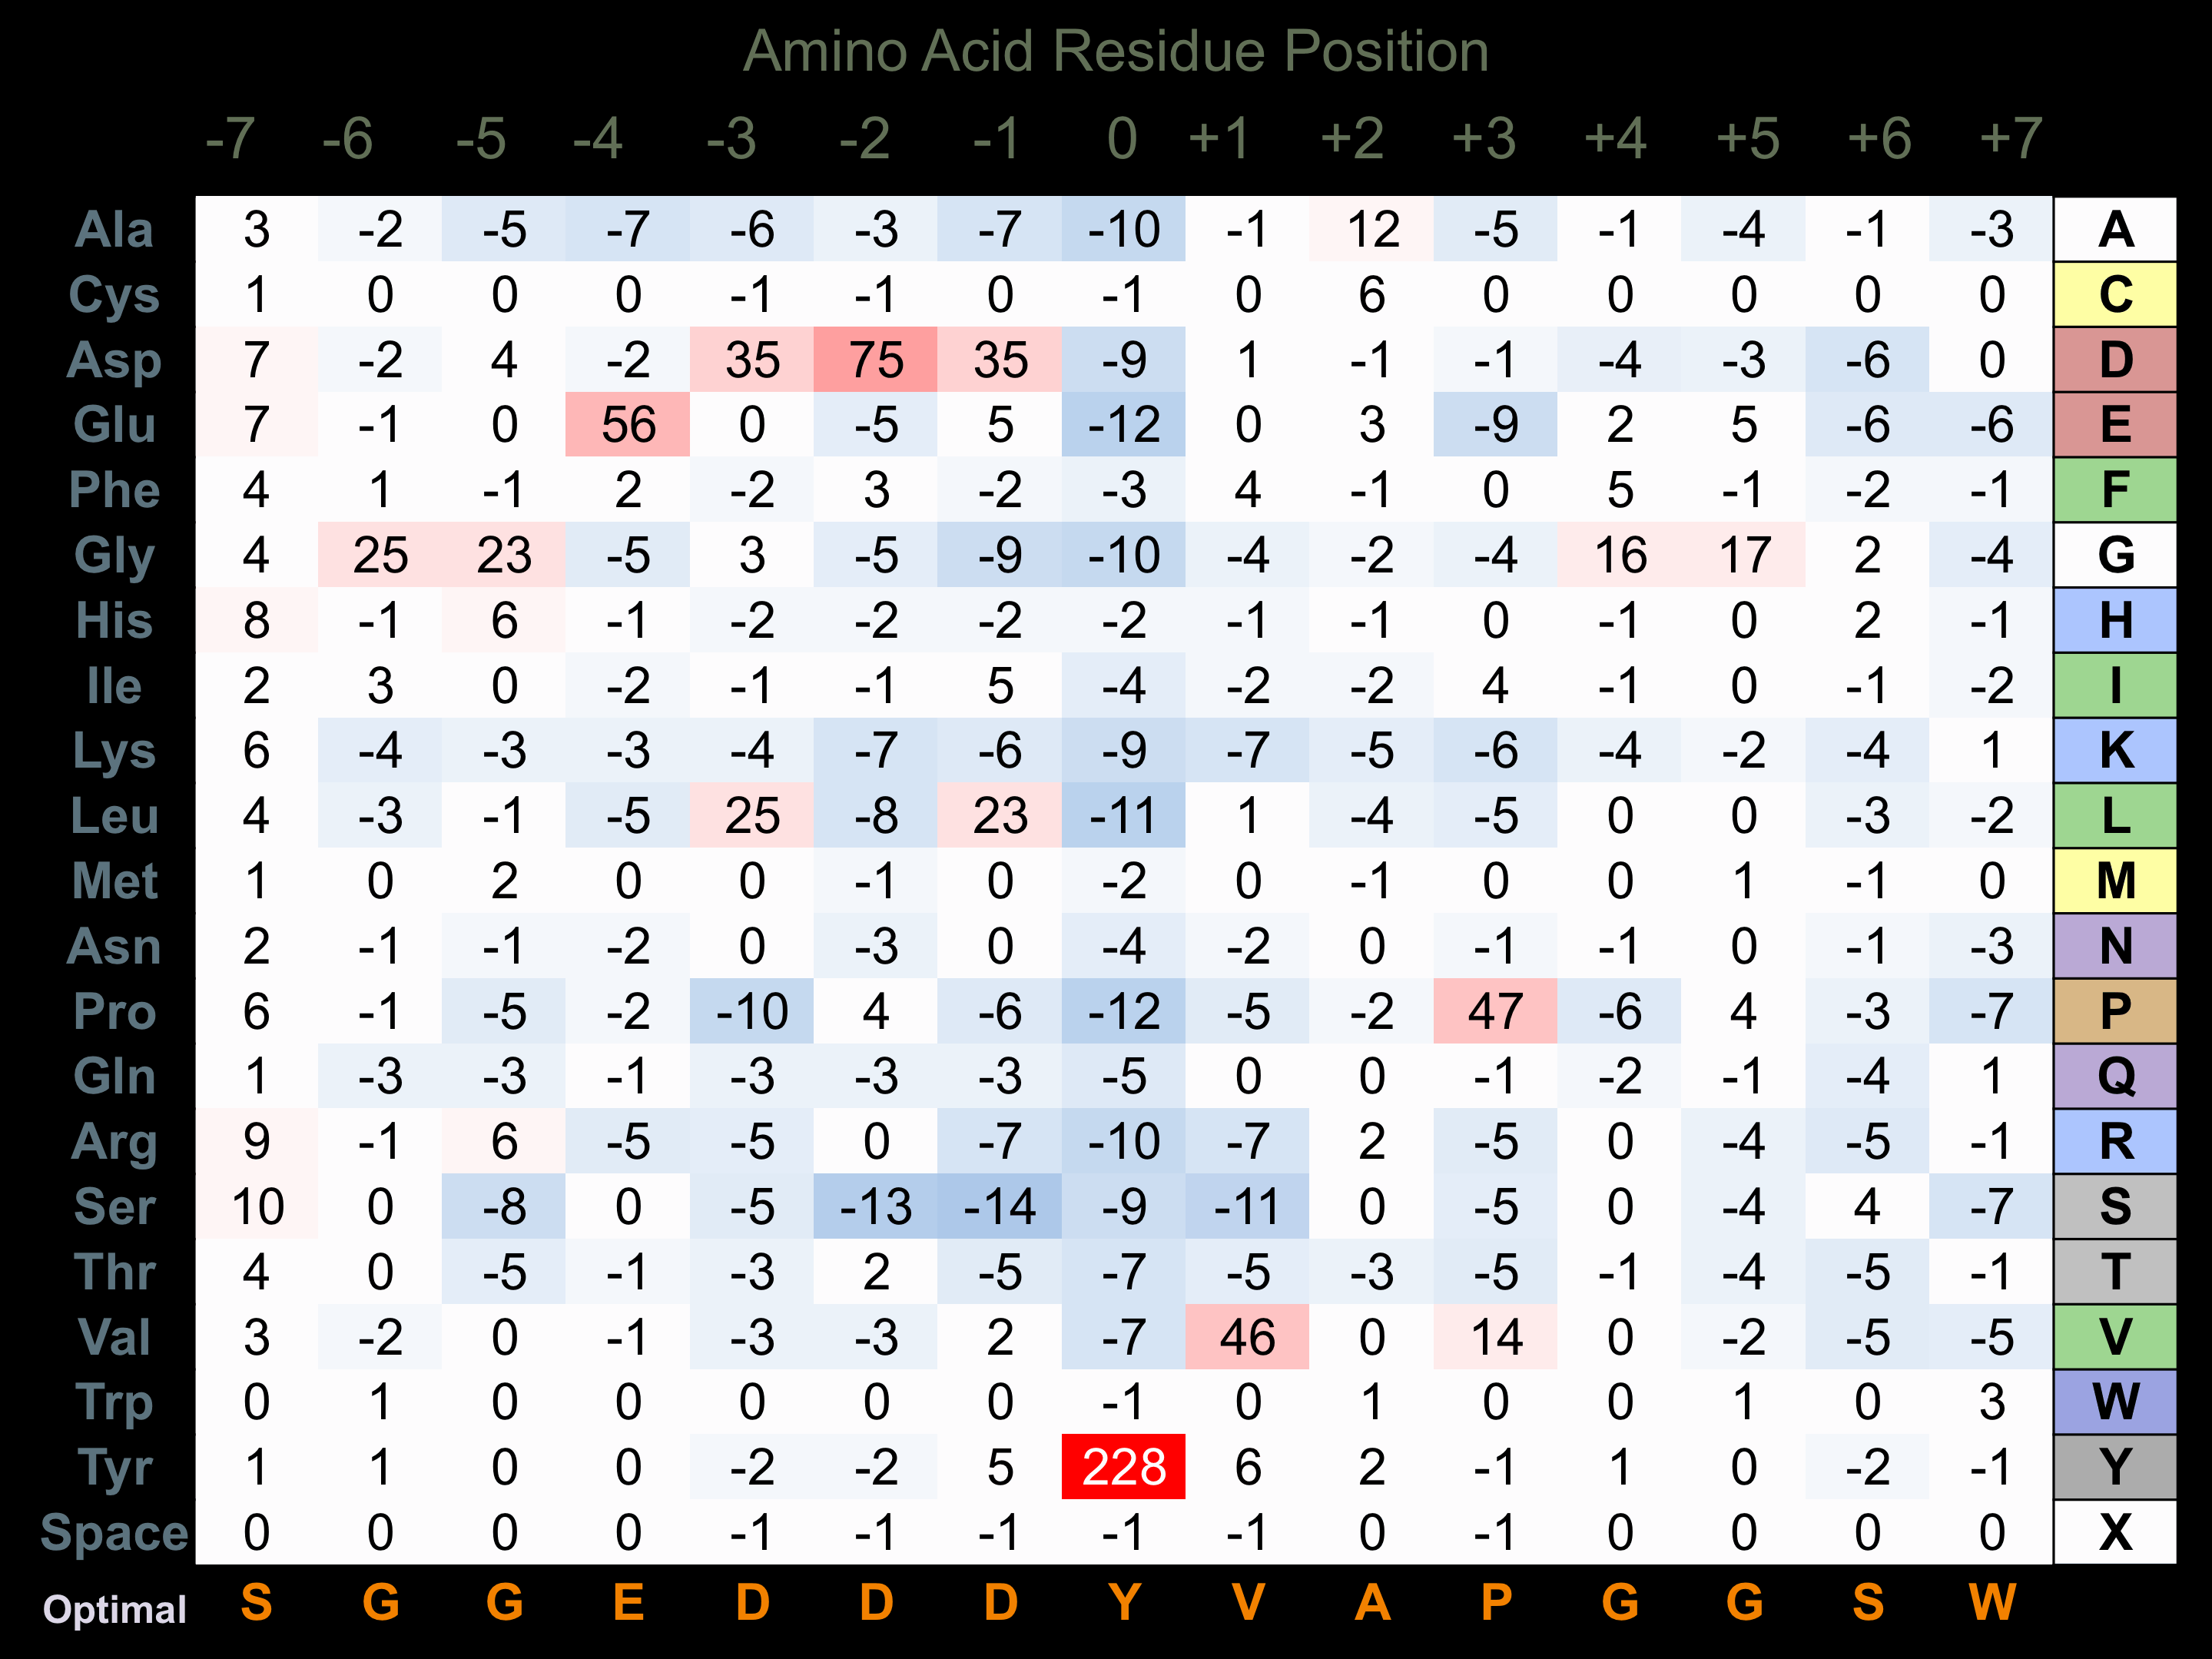
Matrix Type:
Predicted from the application of the Kinexus Kinase Substrate Predictor Version 2.0 algorithm, which was trained with over 10,000 kinase-protein substrate pairs and 8,000 kinase-peptide substrate pairs.
Domain #:
1
Inhibitors
For further details on these inhibitors click on the Compound Name and enter it into DrugKiNET or click on the ID's
Based on in vitro and/or in vivo phosphorylation data
| Compound Name | KD, Ki or IC50 (nM) | PubChem ID | ChEMBL ID | PubMed ID |
|---|
Disease Linkage
General Disease Association:
Cancer
Specific Cancer Types:
Spinal cord ependymoma
Comments:
EPHB3 appears to be an oncoprotein (OP). over-expression of EphB3 has been observed in several cancer types, including colon cancer and lung cancer. Additionally, EphB3 over-expression was demonstrated in non-small cell lung cancer (NSCLC) and the expression level was highly correlated with pathological features, including tumour size, differentiation, and metastasis. over-expression of EphB3 in NSCLC cell lines enhanced cell growth and migration and promoted tumorigenesis. By contrast, EphB3 knockout in NSCLC lines reduced cell proliferation and migration and suppressed tumour growth. Therefore, EphB3 has been implicated as an oncoprotein in several cancer types.
Gene Expression in Cancers:
TranscriptoNET (www.transcriptonet.ca) analysis with mRNA expression data retrieved from the National Center for Biotechnology Information's Gene Expression Omnibus (GEO) database, which was normalized against 60 abundantly and commonly found proteins, indicated altered expression for this protein kinase as shown here as the percent change from normal tissue controls (%CFC) as supported with the Student T-test in the following types of human cancers: Barrett's esophagus epithelial metaplasia (%CFC= -51, p<0.009); Breast epithelial hyperplastic enlarged lobular units (HELU) (%CFC= -46, p<0.016); Cervical cancer (%CFC= +86, p<0.0001); Colon mucosal cell adenomas (%CFC= +144, p<0.0001); Lung adenocarcinomas (%CFC= +90, p<0.001); Ovary adenocarcinomas (%CFC= +135, p<0.034); Prostate cancer (%CFC= +74, p<0.018); Skin melanomas (%CFC= -56, p<0.066); Skin melanomas - malignant (%CFC= -67, p<0.016); Uterine leiomyomas from fibroids (%CFC= +56, p<0.026); and Vulvar intraepithelial neoplasia (%CFC= +61, p<0.008). The COSMIC website notes an up-regulated expression score for EPHB3 in diverse human cancers of 734, which is 1.6-fold of the average score of 462 for the human protein kinases. The down-regulated expression score of 0 for this protein kinase in human cancers was 100% lower than average score of 60 for the human protein kinases.
Mutagenesis Experiments:
Insertional mutagenesis studies in mice have not yet revealed a role for this protein kinase in mouse cancer oncogenesis.
Mutation Rate in All Cancers:
Percent mutation rates per 100 amino acids length in human cancers: 0.09 % in 25423 diverse cancer specimens. This rate is only 13 % higher than the average rate of 0.075 % calculated for human protein kinases in general.
Mutation Rate in Specific Cancers:
Highest percent mutation rates per 100 amino acids length in human cancers: 0.48 % in 805 skin cancers tested; 0.35 % in 1093 large intestine cancers tested; 0.25 % in 589 stomach cancers tested; 0.22 % in 500 urinary tract cancers tested; 0.17 % in 602 endometrium cancers tested; 0.15 % in 1991 lung cancers tested; 0.08 % in 1270 liver cancers tested.
Frequency of Mutated Sites:
Most frequent mutations with the number of reports indicated in brackets: R724Q (5) in the kinase domain.
Comments:
Only 4 deletions, 2 insertions, and no complex mutations are noted on the COSMIC website.