
Nomenclature
Short Name:
EPHB6
Full Name:
Ephrin type-B receptor 6 kinase-defective
Alias:
- EC 2.7.10.1
- EPB6
- EPH6
- EPHB5
- HEP
Classification
Type:
Protein-tyrosine kinase
Group:
TK
Family:
Eph
SubFamily:
NA

Structure
Mol. Mass (Da):
110700
# Amino Acids:
1021
# mRNA Isoforms:
3
mRNA Isoforms:
110,700 Da (1021 AA; O15197); 81,211 Da (744 AA; O15197-2); 57,498 Da (540 AA; O15197-3)
4D Structure:
Interacts with CBL and EPHB1. Interacts with FYN; this interaction takes place in a ligand-independent manner.
1D Structure:
Subfamily Alignment
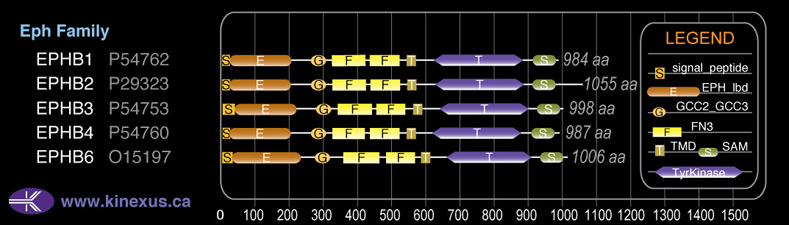
Domain Distribution:
Post-translation Modifications
For detailed information on phosphorylation of this kinase go to PhosphoNET
Methylated:
R125 (M2),K154 (M1).
N-GlcNAcylated:
N480.
Serine phosphorylated:
S168, S169, S170, S171.
Tyrosine phosphorylated:
Y635, Y644, Y645, Y651, Y669, Y785.
Distribution
Based on gene microarray analysis from the NCBI
Human Tissue Distribution
% Max Expression:
Mean Expression:
Number of Samples:
Standard Deviation:
% Max Expression:
Mean Expression:
Number of Samples:
Standard Deviation:
 100
100
1161
16
1997
 3
3
35
10
39
 70
70
816
14
1916
 71
71
822
59
1642
 53
53
618
14
612
 12
12
137
43
184
 18
18
210
19
371
 90
90
1050
33
2499
 27
27
314
10
321
 6
6
65
44
38
 87
87
1011
27
4883
 48
48
556
108
946
 61
61
707
25
2841
 4
4
51
9
31
 29
29
331
24
483
 3
3
39
8
14
 20
20
238
115
1138
 24
24
273
21
588
 23
23
267
56
1489
 73
73
852
56
726
 53
53
611
23
2052
 34
34
393
25
1512
 53
53
615
15
1982
 67
67
773
21
2665
 58
58
675
23
821
 52
52
606
41
678
 15
15
169
28
244
 61
61
710
21
2281
 24
24
278
21
738
 13
13
154
14
60
 88
88
1025
18
693
 78
78
904
21
1338
 28
28
320
50
650
 61
61
705
26
599
 9
9
101
22
86
Evolution
Species Conservation
PhosphoNET % Identity:
PhosphoNET % Similarity:
Homologene %
Identity:
PhosphoNET % Identity:
PhosphoNET % Similarity:
Homologene %
Identity:
 100
100
100
100 99.3
99.3
99.5
99.5 98.5
98.5
99
99 -
-
-
93 -
-
-
93 92.2
92.2
95.1
93 -
-
-
- 92.1
92.1
95.7
93 91.6
91.6
95.4
92 -
-
-
- -
-
-
- 58.6
58.6
73.8
57 47.1
47.1
63.9
- 40.7
40.7
60.6
51 -
-
-
- -
-
-
- -
-
-
- -
-
-
- -
-
-
- -
-
-
- -
-
-
- -
-
-
- -
-
-
- -
-
-
- -
-
-
-
For a wider analysis go to PhosphoNET Evolution in PhosphoNET
Binding Proteins
Examples of known interacting proteins
hiddentext
| No. | Name – UniProt ID |
|---|---|
| 1 | EPHB1 - P54762 |
| 2 | CBL - P22681 |
| 3 | EFNB2 - P52799 |
| 4 | MLLT4 - P55196 |
| 5 | CRK - P46108 |
| 6 | CRKL - P46109 |
| 7 | GRB2 - P62993 |
| 8 | BCL6 - P41182 |
Regulation
Activation:
NA
Inhibition:
NA
Synthesis:
NA
Degradation:
NA
Known Downstream Substrates
For further details on these substrates click on the Substrate Short Name or UniProt ID. Phosphosite Location is hyperlinked to PhosphoNET
predictions.
Based on in vitro and/or in vivo phosphorylation data
| Substrate Short Name | UniProt ID (Human) | Phosphosite Location | Phosphosite Sequence | Effect of Phosphorylation |
|---|
Protein Kinase Specificity
Matrix of observed frequency (%) of amino acids in aligned protein substrate phosphosites
Matrix Type:
Predicted from the application of the Kinexus Kinase Substrate Predictor Version 2.0 algorithm, which was trained with over 10,000 kinase-protein substrate pairs and 8,000 kinase-peptide substrate pairs.
Domain #:
1
Inhibitors
For further details on these inhibitors click on the Compound Name and enter it into DrugKiNET or click on the ID's
Based on in vitro and/or in vivo phosphorylation data
| Compound Name | KD, Ki or IC50 (nM) | PubChem ID | ChEMBL ID | PubMed ID |
|---|
Disease Linkage
General Disease Association:
Cancer
Specific Cancer Types:
Gliosarcomas; Familial colorectal cancer; Colorectal cancer (CRC)
Comments:
EPHB6 may be a tumour suppressor protein (TSP). EphB6 protein expression is down-regulated during tumour progression, which indicates it may function as a tumour suppressor for tumour invasion and metastasis. A study showed transfection of EphB6 cDNA into neuroblastoma cell lines with little endogenous EphB6, as well as mouse xenograft model, resulted in suppression of tumour growth and malignancy.
Gene Expression in Cancers:
TranscriptoNET (www.transcriptonet.ca) analysis with mRNA expression data retrieved from the National Center for Biotechnology Information's Gene Expression Omnibus (GEO) database, which was normalized against 60 abundantly and commonly found proteins, indicated altered expression for this protein kinase as shown here as the percent change from normal tissue controls (%CFC) as supported with the Student T-test in the following types of human cancers: Bladder carcinomas (%CFC= +112, p<0.004); Cervical cancer (%CFC= +74, p<0.027); Colorectal adenocarcinomas (early onset) (%CFC= +61, p<0.008); Lung adenocarcinomas (%CFC= -54, p<(0.0003); Malignant pleural mesotheliomas (MPM) tumours (%CFC= +65, p<0.004); Skin fibrosarcomas (%CFC= -85); Skin melanomas (%CFC= -62, p<0.085); Skin melanomas - malignant (%CFC= -84, p<0.003); Skin squamous cell carcinomas (%CFC= -54, p<0.022); and Uterine leiomyomas from fibroids (%CFC= +69, p<0.053).
Mutagenesis Experiments:
Insertional mutagenesis studies in mice have not yet revealed a role for this protein kinase in mouse cancer oncogenesis.
Mutation Rate in All Cancers:
Percent mutation rates per 100 amino acids length in human cancers: 0.08 % in 12643 diverse cancer specimens. This rate is very similar (+ 3% higher) to the average rate of 0.075 % calculated for human protein kinases in general.
Frequency of Mutated Sites:
None > 5 in 20,810 cancer specimens