• KinATLAS
  • TranscriptoNET
  • PhosphoNET
  • OncoNET
  • KinaseNET
  • DrugKiNET
  • DrugProNET
  • KiNET-AM
  • Kinetica Online

Updated November 2019

Home | Kinexus | Contact | Credits

Nomenclature

Short Name:
FLT3
Full Name:
Fetal liver fms-related tyrosine kinase 3
Alias:
  • CD135
  • FLT-3
  • Fms-related tyrosine kinase 3
  • Kinase Flt3
  • STK-1
  • EC 2.7.10.1
  • Fetal liver kinase 2
  • FL cytokine receptor
  • FLK2
  • FLK-2

Classification

Type:
Protein-tyrosine kinase
Group:
TK
Family:
PDGFR
SubFamily:
NA


Specific Links

BioCarta Entry: eryth pathway
Entrez-Gene Entry: 2322
Entrez-Protein Entry: NP_004110
GeneCards Entry: STK1
KinBASE Entry: FLT3
OMIM Entry: 136351
Pfam Entry: P36888
PhosphoNET Entry: P36888
Phosphosite Plus Entry: 600
Protein Data Bank Entry: 1RJB
ScanSite Entry: P36888
Source Entry: FLT3
UCSD-Nature Entry: A000949
UniProt Entry: P36888
Kinexus Products: FLT3
Fetal liver fms-related tyrosine kinase 3; Receptor-type tyrosine-protein kinase Flt3 pan-specific antibody AB-NK240-1
Fetal liver fms-related tyrosine kinase 3; Receptor-type tyrosine-protein kinase Flt3 pan-specific antibody AB-NK240-2
Fetal liver fms-related tyrosine kinase 3 / Receptor-type tyrosine-protein kinase Flt3 (C35-S50, human) peptide - Powder PE-01AUJ95
Fetal liver fms-related tyrosine kinase 3 / Receptor-type tyrosine-protein kinase Flt3 (K334-G348, human) peptide - Powder PE-01AUK85
Fetal liver fms-related tyrosine kinase 3 / Receptor-type tyrosine-protein kinase Flt3 (D839-R845, human) pY842 phosphopeptide - Powder PE-04AMJ99
Fetal liver fms-related tyrosine kinase 3 / Receptor-type tyrosine-protein kinase Flt3 (D839-R845, human) pY842 phosphopeptide - Powder PE-04AZN00
Fetal liver fms-related tyrosine kinase 3 / Receptor-type tyrosine-protein kinase Flt3 (P966-R972, human) pY969 phosphopeptide - Powder PE-04AZO00

General Links

ClustalW2
GPS-Cuckoo
Human Protein Atlas
Kinase.com
Kinase Research
Kinasource
Kinomer
Netphorest
NetworKIN
Phosida
PhosphoElm
Protein Blast
ScanSite
String

Structure

Mol. Mass (Da):
112903
# Amino Acids:
993
# mRNA Isoforms:
2
mRNA Isoforms:
112,903 Da (993 AA; P36888); 108,378 Da (952 AA; P36888-2)
4D Structure:
Interacts with FIZ1 following ligand activation
1D Structure:
Retrieve Gene Sequence
Retrieve Full Protein Sequence
Retrieve Catalytic Domain Sequence
 
3D Image (rendered using PV Viewer):

PDB ID
1RJB

Subfamily Alignment
subfamily domain
 
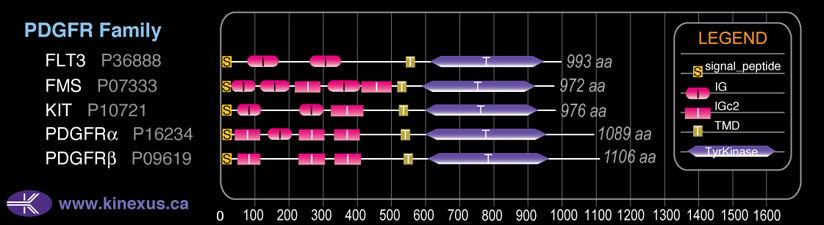
Domain Distribution:
Start End Domain
1 27 signal_peptide
78 161 IG
253 343 IG
542 564 TMD
610 943 TyrKc
610 945 Pkinase
 

Kinexus Products

Click on entries below for direct links to relevant products from Kinexus for this protein kinase.
hiddentext
○ Fetal liver fms-related tyrosine kinase 3; Receptor-type tyrosine-protein kinase Flt3 pan-specific antibody AB-NK240-1
○ Fetal liver fms-related tyrosine kinase 3; Receptor-type tyrosine-protein kinase Flt3 pan-specific antibody AB-NK240-2
○ Fetal liver fms-related tyrosine kinase 3 / Receptor-type tyrosine-protein kinase Flt3 (C35-S50, human) peptide - Powder PE-01AUJ95
○ Fetal liver fms-related tyrosine kinase 3 / Receptor-type tyrosine-protein kinase Flt3 (K334-G348, human) peptide - Powder PE-01AUK85
○ Fetal liver fms-related tyrosine kinase 3 / Receptor-type tyrosine-protein kinase Flt3 (D839-R845, human) pY842 phosphopeptide - Powder PE-04AMJ99
○ Fetal liver fms-related tyrosine kinase 3 / Receptor-type tyrosine-protein kinase Flt3 (D839-R845, human) pY842 phosphopeptide - Powder PE-04AZN00
○ Fetal liver fms-related tyrosine kinase 3 / Receptor-type tyrosine-protein kinase Flt3 (P966-R972, human) pY969 phosphopeptide - Powder PE-04AZO00
 

Post-translation Modifications

For detailed information on phosphorylation of this kinase go to PhosphoNET
N-GlcNAcylated:
N43, N100, N151, N306, N323, N351, N354, N473, N502, N541.
Serine phosphorylated:

S759, S840, S993.
Threonine phosphorylated:

T343, T728, T968.
Tyrosine phosphorylated:

Y166, Y416, Y572, Y589-, Y591+, Y597, Y599+, Y630, Y726, Y768+, Y793, Y842-, Y889+, Y919+, Y955, Y969+.
Ubiquitinated:
K602, K614, K623, K634, K644, K719, K772, K932.
 

Distribution

Based on gene microarray analysis from the NCBI
Human Tissue Distribution
% Max Expression:

Mean Expression:

Number of Samples:

Standard Deviation:
% Max Expression:

Mean Expression:

Number of Samples:

Standard Deviation:
  • adipose
    100

    1013

    16

    1338

  • adrenal
    3

    28

    11

    21

  • bladder
    2

    23

    24

    38

  • brain
    17

    168

    71

    348

  • breast
    32

    324

    14

    323

  • cervix
    1

    15

    37

    8

  • colon
    41

    412

    23

    579

  • heart
    41

    419

    45

    1212

  • intestine
    21

    213

    10

    201

  • kidney
    12

    118

    77

    159

  • liver
    3

    32

    41

    44

  • lung
    31

    316

    151

    486

  • lymphnode
    6

    60

    35

    32

  • ovary
    3

    32

    12

    29

  • pancreas
    6

    63

    37

    56

  • pituitary
    2

    17

    9

    22

  • prostate
    2

    22

    203

    18

  • salivarygland
    3

    32

    33

    31

  • skeletalmuscle"
    4

    43

    70

    41

  • skin
    25

    258

    56

    314

  • spinalcord
    5

    53

    37

    40

  • spleen
    4

    42

    38

    32

  • stomach
    1

    14

    30

    17

  • testis
    3

    32

    31

    51

  • thymus
    5

    55

    37

    45

  • thyroid
    93

    947

    50

    2682

  • tonsil
    3

    34

    38

    26

  • trachea
    3

    28

    33

    41

  • uterus
    2

    17

    30

    22

  • reticulocytes"
    17

    169

    14

    123

  • t-lymphocytes
    45

    460

    18

    328

  • b-lymphocytes
    59

    598

    21

    638

  • neutrophils
    8

    79

    52

    193

  • macrophages
    68

    691

    31

    720

  • sperm
    13

    130

    22

    82


Evolution

Species Conservation
PhosphoNET % Identity:
PhosphoNET % Similarity:
Homologene %
Identity:
PhosphoNET % Identity:
PhosphoNET % Similarity:
Homologene %
Identity:
  • tableheader
    100

    100

    100
  • tableheader
    99

    99.5

    99
  • tableheader
    99

    99.5

    96.5
  • tableheader
    -

    -

    91
  • tableheader
    -

    -

    89
  • tableheader
    96.5

    98.5

    92
  • tableheader
    30.3

    48.5

    -
  • tableheader
    -

    -

    86
  • tableheader
    84

    89.7

    84.5
  • tableheader
    29.6

    47.6

    -
  • tableheader
    66.9

    80.6

    -
  • tableheader
    66.9

    80.6

    57
  • tableheader
    31.5

    48.4

    52
  • tableheader
    30.7

    46.6

    46
  • tableheader
    33.8

    49.8

    -
  • tableheader
    30.6

    47.4

    -
  • tableheader
    -

    -

    -
  • tableheader
    -

    -

    -
  • tableheader
    -

    -

    -
  • tableheader
    -

    -

    -
  • tableheader
    -

    -

    -
  • tableheader
    -

    -

    -
  • tableheader
    -

    -

    -
  • tableheader
    -

    -

    -
  • tableheader
    -

    -

    -
For a wider analysis go to PhosphoNET Evolution in PhosphoNET
 

Binding Proteins

Examples of known interacting proteins
hiddentext
No. Name – UniProt ID
1 PTPN6 - P29350
2 PTPN12 - Q05209
3 FLT3LG - P49771
4 CBLB - Q13191
5 NCK1 - P16333
6 FIZ1 - Q96SL8
7 PIK3R1 - P27986
 

Regulation

Activation:
Phosphorylation of Tyr-591 increases phosphotransferase activity. Phosphorylation of Tyr-599 increases phosphotransferase activity and induces interaction with SHP2 and Src.
Inhibition:
Phosphorylation of Tyr-589 inhibits phosphotransferase activity and induces interaction with Src. Phosphorylation of Tyr-842 inhibits phosphotransferase activity.
Synthesis:
NA
Degradation:
NA
 

Kinections Map

Click here to download a PPT of the image below
 
Kinections GIF
 

Known Upstream Kinases

For further details on these substrates click on the Substrate Short Name or UniProt ID. Phosphosite Location is hyperlinked to PhosphoNET predictions.
Based on in vitro and/or in vivo phosphorylation data

Kinase Short Name UniProt ID (Human) Phosphosite Location Phosphosite Sequence Effect of Phosphorylation
FLT3 P36888 Y589 TGSSDNEYFYVDFRE -
FLT3 P36888 Y591 SSDNEYFYVDFREYE +
FLT3 P36888 Y599 VDFREYEYDLKWEFP +
FLT3 P36888 Y726 KEHNFSFYPTFQSHP
FLT3 P36888 Y842 DIMSDSNYVVRGNAR -
FLT3 P36888 Y955 ADAEEAMYQNVDGRV ?
FLT3 P36888 Y969 VSECPHTYQNRRPFS +
 

Known Downstream Substrates

For further details on these substrates click on the Substrate Short Name or UniProt ID. Phosphosite Location is hyperlinked to PhosphoNET predictions.
Based on in vitro and/or in vivo phosphorylation data

Substrate Short Name UniProt ID (Human) Phosphosite Location Phosphosite Sequence Effect of Phosphorylation
EphB6 O15197 Y628 RKRRGTGYTEQLQQY
EphB6 O15197 Y635 YTEQLQQYSSPGLGV
FLT3 P36888 Y589 TGSSDNEYFYVDFRE -
FLT3 P36888 Y591 SSDNEYFYVDFREYE +
FLT3 P36888 Y599 VDFREYEYDLKWEFP +
FLT3 P36888 Y726 KEHNFSFYPTFQSHP
FLT3 P36888 Y842 DIMSDSNYVVRGNAR -
FLT3 P36888 Y955 ADAEEAMYQNVDGRV ?
FLT3 P36888 Y969 VSECPHTYQNRRPFS +
 

Protein Kinase Specificity

Matrix of observed frequency (%) of amino acids in aligned protein substrate phosphosites

Kinections GIF
Matrix Type:
Predicted from the application of the Kinexus Kinase Substrate Predictor Version 2.0 algorithm, which was trained with over 10,000 kinase-protein substrate pairs and 8,000 kinase-peptide substrate pairs.
Domain #:
1
 

Inhibitors

For further details on these inhibitors click on the Compound Name and enter it into DrugKiNET or click on the ID's
Based on in vitro and/or in vivo phosphorylation data
Compound Name KD, Ki or IC50 (nM) PubChem ID ChEMBL ID PubMed ID
Staurosporine IC50 = 180 pM 5279 22104147
Sunitinib Kd = 410 pM 5329102 535 22037378
AST-487 Kd = 510 pM 11409972 574738 22037378
Lestaurtinib Kd = 540 pM 126565 18183025
SU14813 Kd = 540 pM 10138259 1721885
Linifanib Kd = 630 pM 11485656 223360 18183025
Dovitinib Kd = 640 pM 57336746 18183025
R406 Kd = 710 pM 11984591 22037378
Foretinib Kd = 900 pM 42642645 1230609 22037378
BML-275 IC50 = 1 nM 11524144 478629 20932747
CHEMBL1684800 IC50 = 1 nM 52938983 1684800 21353571
Quizartinib Kd = 1.3 nM 24889392 576982 22037378
DCC2036 IC50 = 1.7 nM 25066467
CHEMBL1784637 IC50 = 2 nM 46864270 1784637 21561767
CHEMBL223147 IC50 = 2 nM 24894130 223147 18630890
ENMD 2076 IC50 = 3 nM 16041424 19320489
NVP-TAE684 IC50 = 3 nM 16038120 509032 18077425
Tandutinib Kd = 3 nM 3038522 124660 18183025
Sorafenib IC50 = 3.2 nM 216239 1336 19654408
Nintedanib Kd = 3.8 nM 9809715 22037378
2hiw EC50 > 4 nM 10062694 18077425
Tozasertib Kd = 4.3 nM 5494449 572878 18183025
CHIR-124 IC50 = 5.8 nM 11502647 17255282
N-Benzoylstaurosporine Kd = 6 nM 56603681 608533 18183025
AZD1152 Kd = 8 nM 11497983 19320489
Barasertib Kd = 8.2 nM 16007391 215152 18183025
Hesperadin Kd < 10 nM 10142586 514409 19035792
Cabozantinib IC50 = 11.3 nM 25102847 21926191
Ponatinib IC50 = 12.6 nM 24826799 19878872
TG101348 Kd = 13 nM 16722836 1287853 22037378
KW2449 Kd = 15 nM 11427553 1908397 22037378
BMS-777607 IC50 = 16 nM 24794418 19260711
SureCN10063060 Ki = 20 nM 52936621 21391610
MK2461 IC50 = 22 nM 44137946 21608528
Cdk1/2 Inhibitor III IC50 < 25 nM 5330812 261720 22037377
Flt-3 Inhibitor III IC50 < 25 nM 11772958 22037377
GSK-3 Inhibitor IX IC50 < 25 nM 5287844 409450 22037377
IDR E804 IC50 < 25 nM 6419764 1802727 22037377
Indirubin-3′-monoxime IC50 < 25 nM 5326739 22037377
JAK3 Inhibitor VI IC50 < 25 nM 16760524 22037377
K-252a; Nocardiopsis sp. IC50 < 25 nM 3813 281948 22037377
Lck Inhibitor IC50 < 25 nM 6603792 22037377
PKR Inhibitor IC50 < 25 nM 6490494 235641 22037377
SB218078 IC50 < 25 nM 447446 289422 22037377
Src Kinase Inhibitor I IC50 < 25 nM 1474853 97771 22037377
SU11652 IC50 < 25 nM 24906267 13485 22037377
Syk Inhibitor IC50 < 25 nM 6419747 104279 22037377
TAK901 IC50 = 25 nM 16124208
TG101209 IC50 = 25 nM 16722832 17541402
VEGFR2 Kinase Inhibitor II IC50 < 25 nM 5329155 88606 22037377
AT9283 IC50 < 30 nM 24905142 19143567
CHEMBL511337 Kd = 30 nM 44588220 511337 19035792
Flt-3 Inhibitor II IC50 = 33 nM 11601743 377193 16722630
Ki11502 IC50 = 37.54 nM 18309036
Enzastaurin Kd = 40 nM 176167 300138 22037378
Axitinib Kd = 42 nM 6450551 1289926 22037378
ST078197 IC50 = 42 nM 1048845 210833 16580199
A674563 Kd = 43 nM 11314340 379218 22037378
CHEMBL482967 Ki = 44 nM 6420138 482967 20462263
SGI-1776 IC50 = 44 nM 19734450
1;9-Pyrazoloanthrone IC50 > 50 nM 8515 7064 22037377
AC1NS4N8 Kd < 50 nM 5353854 101797 19035792
AG-E-60384 IC50 > 50 nM 6419741 413188 22037377
ALX-270-403-M001 IC50 > 50 nM 22037377
BCP9000906 IC50 > 50 nM 5494425 21156 22037377
Bisindolylmaleimide I IC50 > 50 nM 2396 7463 22037377
CGP74514A IC50 > 50 nM 2794188 367625 22037377
Gö6976 IC50 > 50 nM 3501 302449 22037377
GSK-3 Inhibitor XIII IC50 > 50 nM 6419766 359482 22037377
IKK-2 Inhibitor IV IC50 > 50 nM 9903786 257167 22037377
MGCD-265 IC50 < 50 nM 24901704 18434145
NU6140 IC50 > 50 nM 10202471 1802728 22037377
PF-03814735 IC50 < 50 nM 49830590 20354118
PKCb Inhibitor IC50 > 50 nM 6419755 366266 22037377
SU6656 IC50 > 50 nM 5353978 605003 22037377
SU9516 IC50 > 50 nM 5289419 258805 22037377
SureCN373973 Kd < 50 nM 9818573 30678 19035792
VEGFR2 Kinase Inhibitor I IC50 > 50 nM 6419834 86943 22037377
VEGFR2 Kinase Inhibitor IV IC50 > 50 nM 5329468 92461 22037377
WHI-P154 IC50 > 50 nM 3795 473773 22037377
Silmitasertib IC50 = 55 nM 24748573 21174434
CHEMBL1288582 IC50 = 60 nM 49839480 1288582 20965724
CHEMBL1240703 Kd = 68 nM 52945601 1240703 19654408
Motesanib Kd = 71 nM 11667893 572881 18183025
CHEMBL1650545 IC50 = 76 nM 53316611 1650545 21128646
Amuvatinib IC50 = 81 nM 16058702
BMS-690514 IC50 = 110 nM 11349170 21531814
Erlotinib Kd = 130 nM 176870 553 18183025
Ruboxistaurin Kd = 130 nM 153999 91829 18183025
AGL2043 IC50 > 150 nM 9817165 22037377
Alsterpaullone IC50 > 150 nM 5005498 50894 22037377
Alsterpaullone; 2-Cyanoethyl IC50 > 150 nM 16760286 260138 22037377
Bisindolylmaleimide IV IC50 > 150 nM 2399 266487 22037377
Compound 52 IC50 > 150 nM 2856 22037377
Compound 56 IC50 > 150 nM 2857 29197 22037377
Gö6983 IC50 > 150 nM 3499 261491 22037377
GSK-3 Inhibitor X IC50 > 150 nM 6538818 430226 22037377
JNJ-10198409 IC50 > 150 nM 9797370 120077 22037377
PKR Inhibitor; Negative Control IC50 > 150 nM 16760619 22037377
Purvalanol A IC50 > 150 nM 456214 23327 22037377
SU11274 IC50 > 150 nM 9549297 261641 22037377
SU4312 IC50 > 150 nM 6450842 328710 22037377
SureCN7018367 Kd < 150 nM 18792927 450519 19035792
Semaxinib IC50 = 160 nM 5329098 276711 20117004
BMS-754807 IC50 = 170 nM 24785538 19996272
Crizotinib Kd = 210 nM 11626560 601719 22037378
AG1478 IC50 > 250 nM 2051 7917 22037377
Bosutinib IC50 > 250 nM 5328940 288441 22037377
BPIQ-I IC50 > 250 nM 2427 22037377
IRAK-1-4 Inhibitor I IC50 > 250 nM 11983295 379787 22037377
Pazopanib IC50 > 250 nM 10113978 477772 22037377
PDGF Receptor Tyrosine Kinase Inhibitor III IC50 > 250 nM 10907042 22037377
PHA-665752 Kd = 250 nM 10461815 450786 22037378
Ro-32-0432 IC50 > 250 nM 127757 26501 22037377
Syk Inhibitor II IC50 > 250 nM 16760670 22037377
TWS119 IC50 > 250 nM 9549289 405759 22037377
CHEMBL201511 IC50 = 270 nM 11530963 201511 18529047
GTP-14564 IC50 = 300 nM 3385203 406375 18077363
AMG458 IC50 = 391 nM 16086104 386661 18553959
GSK461364A Kd = 410 nM 15983966 1908394 22037378
Tivozanib IC50 = 422 nM 9911830 16982756
AG1295 IC50 = 500 nM 2048 7724 22037377
Aloisine A IC50 = 500 nM 5326843 75680 22037377
Aloisine; RP106 IC50 = 500 nM 44350092 126343 22037377
AZ960 IC50 < 500 nM 25099184 18775810
BML-277 IC50 = 500 nM 9969021 179583 22037377
Kenpaullone IC50 = 500 nM 3820 296586 22037377
Vandetanib Kd = 560 nM 3081361 24828 18183025
JNJ-7706621 Kd = 590 nM 5330790 191003 18183025
Danusertib IC50 = 669 nM 21874004 402548 17125279
Canertinib Kd = 730 nM 156414 31965 18183025
4557W IC50 > 1 µM 9843206 563845 22037377
A 443654 IC50 < 1 µM 10172943 379300 19465931
AG1296 IC50 > 1 µM 2049 71191 22037377
Alisertib IC50 > 1 µM 24771867 22016509
AS601245 IC50 > 1 µM 11422035 191384 22037377
CCT128930 IC50 = 1 µM 17751819 18345609
FR180204 IC50 > 1 µM 11493598 259551 22037377
Gefitinib Kd = 1 µM 123631 939 18183025
Icotinib IC50 > 1 µM 22024915 22112293
JNK Inhibitor; Negative Control IC50 > 1 µM 11665831 22037377
MK5108 IC50 > 1 µM 24748204 20053775
SNS314 IC50 > 1 µM 16047143 514582 18678489
STO609 IC50 > 1 µM 51371511 22037377
SureCN4139760 IC50 > 1 µM 25065806 18691885
WZ3146 Kd > 1 µM 44607360 20033049
WZ4002 Kd > 1 µM 44607530 20033049
LKB1(AAK1 dual inhibitor) Kd < 1.25 µM 44588117 516312 19035792
Doramapimod Kd = 1.3 µM 156422 103667 15711537
PLX4720 Kd = 1.3 µM 24180719 1230020 22037378
OSI-930 IC50 = 1.303 µM 53396311 16424037
CHEMBL493169 Ki = 1.4 µM 44219632 493169 19414255
Pyrimidylpyrrole, 11e Ki = 1.4 µM 11634725 583042 19827834
RAF265 Kd = 1.4 µM 11656518 558752 18183025
CUDC-101 IC50 = 1.5 µM 24756910 598797 20143778
Momelotinib IC50 > 2 µM 25062766 19295546
Pelitinib Kd = 2 µM 6445562 607707 18183025
CHEMBL494221 Ki > 2.3 µM 5328125 494221 19414255
CHEMBL248757 Ki > 2.481 µM 44444843 248757 17935989
JNK Inhibitor VIII Ki > 2.5 µM 11624601 210618 16759099
Kinome_3024 Ki > 2.5 µM 11539329 210963 16759099
Kinome_3027 Ki > 2.5 µM 11640926 378627 16759099
Kinome_3028 Ki > 2.5 µM 11590363 210928 16759099
PI-103 Kd = 2.5 µM 16739368 538346 22037378
GDC-0941 Kd = 2.6 µM 17755052 521851 22037378
SNS032 Kd = 3 µM 3025986 296468 18183025
Alvocidib Kd = 3.2 µM 9910986 428690 18183025
SureCN4875304 IC50 > 3.5 µM 46871765 20472445
JNJ-28871063 IC50 > 4 µM 17747413 17975007
Dasatinib Kd = 4.8 µM 11153014 1421 22037378
 

Disease Linkage

General Disease Association:

Cancer
Specific Cancer Types:
Acute myelogenous leukemias (AML); Myeloid leukemias; Leukemias; Lymphoblastic leukemias; Juvenile myelomonocytic leukemias (JMML); Gastrointestinal stromal tumours (GANT); Myelodysplastic syndromes (MSD); Acute promyelocytic leukemias (APL); Cytogenetically normal Acute myeloid leukemias (AML); Core binding factor Acute myeloid leukemias (AML); Chronic myelomonocytic leukemias (CMML); Tetraploidy; Myeloid sarcomas; Acute myeloid leukemias (AML) with T(6;9)(p23;q34); Chronic myeloproliferative disease (CMPD); 8p11 Myeloproliferative syndrome; Bone marrow cancer; Acute myelomonocytic leukemias (AMML); Acute biphenotypic leukemias (BAL); Precursor T-cell acute lymphoblastic leukemias; Leukemias, acute lymphoblastic 3 (B-ALL); Acute myeloblastic leukemias with maturation; Acute myeloid leukemias (AML) with T(8;21)(q22;q22) Translocation; Acute myeloid leukemias (AML) with abnormal bone marrow eosinophils Inv(16)(p13q22) or T(16;16)(p13;q22); Acute myeloblastic leukemias (AML) without maturation; Leukemias, acute lymphoblastic, somatic; Minimally differentiated acute myeloblastic leukemias (AML)
Comments:
FLT3 is a known oncoprotein (OP). Cancer-related mutations in human tumours point to a gain of function of the protein kinase. The active form of the protein kinase normally acts to promote tumour cell proliferation. FLT3 is linked with Acute Myeloid Leukemia (AML), which is a rare blood cancer disease which will displace healthy blood cells and can lead to fever, shortness of breath, fatigue, and easy bruising. Myeloid Leukemia is a cancer of the myeloid progenitor cells and it can affect myeloid, bone, and bone marrow. Lymphoblastic Leukemia is related to leukemia and can affect T cells, B cells, and bone tissue. Juvenile Myelomonocytic Leukemia (JMML) is a rare chronic blood leukemia that mostly affects young (under 4 years) children. Myelodysplastic Syndromes (MSD) is a rare bone marrow cancer resulting in insufficient functioning and circulating red blood cells. Acute Promyelocytic Leukemia is also a rare bone marrow cancer. Tetraploidy is a rare chromosomal aberration disorder that is related to leukemia. The rare cancer Myeloid Sarcoma is characterized by an accumulation of white blood cells forming a solid cellular mass. Chronic Myeloproliferative Disease is another rare cancer of the bone marrow which results in impaired red blood cell production. Chronic Myeloproliferative Disease (CMPD) is a slow growing cancer. Acute Biphenotypic Leukemia (BAL) is a rare cancer arising from both the lymphoid and myeloid lineages. BAL is related to the complement cascade and clotting cascade pathways. Precursor T-Cell Acute Lymphoblastic Leukemia is a rare cancer and some of its related pathways include the gefitinib pathway, and the cytokine inflammatory response. Leukemia, Acute Lymphoblastic 3 (B-ALL) is a rare cancer which is related to the gefitinib and the transcription factors in neurogenesis pathways. Acute Myeloblastic Leukemia with Maturation is a sub-type of AML. Acute Myeloblastic Leukemia Without Maturation is a rapidly progressing form of leukemia where white blood cells are overproduced in the bone marrow. Minimally Differentiated Acute Myeloblastic Leukemia is a subtype of AML. Gastrointestinal Stromal tumour (GANT) is a soft tissue sarcoma growing from the stomach, intestines, or rectum. STAT5A activation can be inhibited with a Y589F or Y591F mutation. The Y599F mutation can interrupt FLT3 complex formation with PTPN11/SHP2. FLT3 Kinase phosphotransferase activity can abolished with a K644A mutation.
 
Gene Expression in Cancers:

TranscriptoNET (www.transcriptonet.ca) analysis with mRNA expression data retrieved from the National Center for Biotechnology Information's Gene Expression Omnibus (GEO) database, which was normalized against 60 abundantly and commonly found proteins, indicated altered expression for this protein kinase as shown here as the percent change from normal tissue controls (%CFC) as supported with the Student T-test in the following types of human cancers: Brain glioblastomas (%CFC= +357, p<0.057); and Breast epithelial carcinomas (%CFC= +147, p<0.037). The COSMIC website notes an up-regulated expression score for FLT3 in diverse human cancers of 299, which is 0.7-fold of the average score of 462 for the human protein kinases. The down-regulated expression score of 0 for this protein kinase in human cancers was 100% lower than the average score of 60 for the human protein kinases.
Mutagenesis Experiments:

Insertional mutagenesis studies in mice support a role for this protein kinase in mouse cancer oncogenesis.
Mutation Rate in All Cancers:

Percent mutation rates per 100 amino acids length in human cancers: 1.53 % in 103570 diverse cancer specimens. This rate is 20.45-fold higher than the average rate of 0.075 % calculated for human protein kinases in general.
Mutation Rate in Specific Cancers:

Highest percent mutation rates per 100 amino acids length in human cancers: 2.06 % in 74463 haematopoietic and lymphoid cancers tested; 0.4 % in 1468 skin cancers tested; 0.38 % in 1712 large intestine cancers tested; 0.15 % in 743 endometrium cancers tested; 0.13 % in 856 stomach cancers tested; 0.13 % in 2889 lung cancers tested; 0.12 % in 1270 liver cancers tested; 0.11 % in 1176 ovary cancers tested; 0.05 % in 2001 central nervous system cancers tested.
Frequency of Mutated Sites:

Most frequent mutations with the number of reports indicated in brackets: D835Y (211); D835? (707); D835E (27).
Comments:
A large number of complex mutations and insertions mutations are clustered between amino acid residues 569 and 627. Over 50 deletionsmutations occurred at amino acid residues 835 and 836. These mutation patterns are consistent with FLT3 as an oncoprotein.
 
COSMIC Entry:
FLT3
OMIM Entry:
136351
  • Home
  • Top of Page
Copyright 2019 Kinexus BioInformatics Corporation