
Nomenclature
Short Name:
LIMK2
Full Name:
LIM domain kinase 2
Alias:
- EC 2.7.11.1
Classification
Type:
Protein-serine/threonine kinase
Group:
TKL
Family:
LISK
SubFamily:
LIMK

Specific Links
Structure
Mol. Mass (Da):
72,232
# Amino Acids:
638
# mRNA Isoforms:
3
mRNA Isoforms:
77,886 Da (686 AA; P53671-3); 72,232 Da (638 AA; P53671); 69,904 Da (617 AA; P53671-2)
4D Structure:
Binds ROCK1 and LKAP. Interacts with PARD3. Interacts with NISCH
1D Structure:
3D Image (rendered using PV Viewer):
PDB ID
Subfamily Alignment
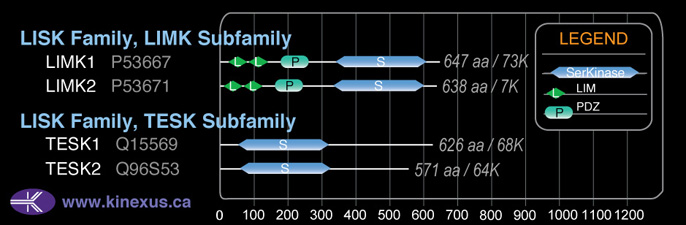
Domain Distribution:
Post-translation Modifications
For detailed information on phosphorylation of this kinase go to PhosphoNET
Acetylated:
K355.
Serine phosphorylated:
S149, S166, S168, S191, S283, S287, S289, S291, S293, S297, S298, S318.
Threonine phosphorylated:
T151, T179, T210, T278, T494+, T505+.
Distribution
Based on gene microarray analysis from the NCBI
Human Tissue Distribution
% Max Expression:
Mean Expression:
Number of Samples:
Standard Deviation:
% Max Expression:
Mean Expression:
Number of Samples:
Standard Deviation:
 100
100
1513
42
2372
 4
4
58
20
45
 4
4
67
32
45
 22
22
329
155
771
 60
60
907
35
661
 17
17
259
119
720
 19
19
284
43
441
 65
65
976
73
2400
 39
39
584
24
449
 6
6
95
132
107
 4
4
61
59
62
 43
43
658
262
611
 5
5
70
65
65
 6
6
85
15
59
 6
6
97
50
73
 4
4
54
22
40
 9
9
140
155
79
 6
6
98
43
82
 4
4
58
153
46
 47
47
716
162
697
 13
13
192
47
147
 6
6
94
51
88
 12
12
180
51
130
 6
6
92
43
72
 7
7
104
47
100
 47
47
718
97
1258
 6
6
87
68
62
 12
12
183
43
131
 6
6
84
43
58
 8
8
116
42
111
 34
34
518
42
447
 36
36
549
51
532
 17
17
258
91
319
 58
58
879
88
767
 12
12
179
66
260
Evolution
Species Conservation
PhosphoNET % Identity:
PhosphoNET % Similarity:
Homologene %
Identity:
PhosphoNET % Identity:
PhosphoNET % Similarity:
Homologene %
Identity:
 100
100
100
100 54.4
54.4
70.6
100 -
-
-
- -
-
-
92 -
-
-
96 95.5
95.5
97.7
95.5 -
-
-
- 93.1
93.1
96.1
93 93
93
96.1
93 -
-
-
- 86
86
91.5
- 86
86
91.3
86.5 52.8
52.8
69
65 65.8
65.8
77.1
70 -
-
-
- 25
25
34.2
- 29.7
29.7
41.9
- -
-
-
- -
-
-
- -
-
-
- -
-
-
- -
-
-
- -
-
-
- -
-
-
- -
-
-
-
For a wider analysis go to PhosphoNET Evolution in PhosphoNET
Binding Proteins
Examples of known interacting proteins
hiddentext
| No. | Name – UniProt ID |
|---|---|
| 1 | ROCK2 - O75116 |
| 2 | HIPK3 - Q9H422 |
| 3 | SSH1 - Q8WYL5 |
Regulation
Activation:
Phosphorylation of Ser-283 inhibits nuclear import of LIMK2.
Inhibition:
NA
Synthesis:
NA
Degradation:
NA
Known Upstream Kinases
For further details on these substrates click on the Substrate Short Name or UniProt ID. Phosphosite Location is hyperlinked to PhosphoNET
predictions.
Based on in vitro and/or in vivo phosphorylation data
| Kinase Short Name | UniProt ID (Human) | Phosphosite Location | Phosphosite Sequence | Effect of Phosphorylation |
|---|
Known Downstream Substrates
For further details on these substrates click on the Substrate Short Name or UniProt ID. Phosphosite Location is hyperlinked to PhosphoNET
predictions.
Based on in vitro and/or in vivo phosphorylation data
| Substrate Short Name | UniProt ID (Human) | Phosphosite Location | Phosphosite Sequence | Effect of Phosphorylation |
|---|
Protein Kinase Specificity
Matrix of observed frequency (%) of amino acids in aligned protein substrate phosphosites
Matrix Type:
Predicted from the application of the Kinexus Kinase Substrate Predictor Version 2.0 algorithm, which was trained with over 10,000 kinase-protein substrate pairs and 8,000 kinase-peptide substrate pairs.
Domain #:
1
Inhibitors
For further details on these inhibitors click on the Compound Name and enter it into DrugKiNET or click on the ID's
Based on in vitro and/or in vivo phosphorylation data
| Compound Name | KD, Ki or IC50 (nM) | PubChem ID | ChEMBL ID | PubMed ID |
|---|
| Dasatinib | Kd = 86 nM | 11153014 | 1421 | 18183025 |
| PD173955 | Kd = 310 nM | 447077 | 386051 | 22037378 |
| Pazopanib | Kd = 390 nM | 10113978 | 477772 | 18183025 |
| Ki-20227 | Kd = 500 nM | 9869779 | 1908396 | 22037378 |
| PLX4720 | Kd = 620 nM | 24180719 | 1230020 | 22037378 |
| Crizotinib | Kd = 690 nM | 11626560 | 601719 | 22037378 |
| JNJ-7706621 | Kd = 1 µM | 5330790 | 191003 | 18183025 |
| WZ3146 | Kd > 1 µM | 44607360 | 20033049 | |
| WZ4002 | Kd > 1 µM | 44607530 | 20033049 | |
| NVP-TAE684 | Kd = 1.1 µM | 16038120 | 509032 | 22037378 |
| CHEMBL249097 | Kd < 1.25 µM | 25138012 | 249097 | 19035792 |
| IKK-2 Inhibitor IV | Kd < 1.25 µM | 9903786 | 257167 | 19035792 |
| R406 | Kd = 1.4 µM | 11984591 | 22037378 | |
| Foretinib | Kd = 1.7 µM | 42642645 | 1230609 | 22037378 |
| AST-487 | Kd = 1.8 µM | 11409972 | 574738 | 22037378 |
| Tozasertib | Kd < 2.5 µM | 5494449 | 572878 | 19035792 |
| CHEMBL573339 | Kd = 3.5 µM | 9884685 | 573339 | 18183025 |
| PI-103 | Kd = 3.5 µM | 16739368 | 538346 | 18183025 |
| Linifanib | Kd = 4.7 µM | 11485656 | 223360 | 18183025 |
Disease Linkage
Gene Expression in Cancers:
TranscriptoNET (www.transcriptonet.ca) analysis with mRNA expression data retrieved from the National Center for Biotechnology Information's Gene Expression Omnibus (GEO) database, which was normalized against 60 abundantly and commonly found proteins, indicated altered expression for this protein kinase as shown here as the percent change from normal tissue controls (%CFC) as supported with the Student T-test in the following types of human cancers: Breast epithelial carcinomas (%CFC= -54, p<0.006); Classical Hodgkin lymphomas (%CFC= +67, p<0.017); Large B-cell lymphomas (%CFC= +116, p<0.001); Skin melanomas - malignant (%CFC= -59, p<0.001); Uterine leiomyomas (%CFC= +134, p<0.011); and Vulvar intraepithelial neoplasia (%CFC= +55, p<0.024). The COSMIC website notes an up-regulated expression score for LIMK2 in diverse human cancers of 407, which is 0.9-fold of the average score of 462 for the human protein kinases. The down-regulated expression score of 48 for this protein kinase in human cancers was 0.8-fold of the average score of 60 for the human protein kinases.
Mutagenesis Experiments:
Insertional mutagenesis studies in mice have not yet revealed a role for this protein kinase in mouse cancer oncogenesis. A T505E mutation can lead to increased phosphotransferase activity, and T505V substitution can abrogate cofilin phosphorylation and enhancement of stress fiber formation.
Mutation Rate in All Cancers:
Percent mutation rates per 100 amino acids length in human cancers: 0.08 % in 24939 diverse cancer specimens. This rate is very similar (+ 6% higher) to the average rate of 0.075 % calculated for human protein kinases in general.
Mutation Rate in Specific Cancers:
Highest percent mutation rates per 100 amino acids length in human cancers: 0.45 % in 864 skin cancers tested; 0.41 % in 1270 large intestine cancers tested; 0.16 % in 603 endometrium cancers tested; 0.13 % in 589 stomach cancers tested; 0.13 % in 238 bone cancers tested; 0.12 % in 127 biliary tract cancers tested; 0.11 % in 833 ovary cancers tested; 0.11 % in 710 oesophagus cancers tested; 0.11 % in 273 cervix cancers tested; 0.09 % in 1822 lung cancers tested; 0.07 % in 881 prostate cancers tested; 0.06 % in 1512 liver cancers tested; 0.05 % in 2082 central nervous system cancers tested; 0.05 % in 1316 breast cancers tested; 0.05 % in 1276 kidney cancers tested.
Frequency of Mutated Sites:
Most frequent mutations with the number of reports indicated in brackets: R203H (4); R203C (1); R203G (1).
Comments:
Only 4 deletions, and no insertions or complex mutations are noted on the COSMIC website.