
Nomenclature
Short Name:
MOS
Full Name:
Proto-oncogene serine-threonine-protein kinase mos
Alias:
- ADRB2
- C-mos
- EC 2.7.11.1
Classification
Type:
Protein-serine/threonine kinase
Group:
Other
Family:
MOS
SubFamily:
NA

Structure
Mol. Mass (Da):
37,820
# Amino Acids:
346
# mRNA Isoforms:
1
mRNA Isoforms:
37,820 Da (346 AA; P00540)
4D Structure:
NA
1D Structure:
Subfamily Alignment
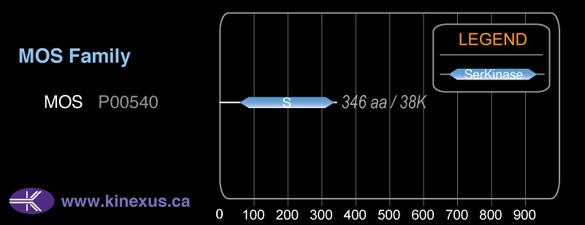
Domain Distribution:
| Start | End | Domain |
|---|---|---|
| 60 | 342 | Pkinase |
Kinexus Products
Click on entries below for direct links to relevant products from Kinexus for this protein kinase.
hiddentext
Post-translation Modifications
For detailed information on phosphorylation of this kinase go to PhosphoNET
Serine phosphorylated:
S3+, S25-, S102-, S340.
Threonine phosphorylated:
T339.
Tyrosine phosphorylated:
Y79, Y263.
Distribution
Based on gene microarray analysis from the NCBI
Human Tissue Distribution
% Max Expression:
Mean Expression:
Number of Samples:
Standard Deviation:
% Max Expression:
Mean Expression:
Number of Samples:
Standard Deviation:
 79
79
1361
13
1579
 2
2
41
8
47
 4
4
63
1
0
 12
12
210
40
347
 11
11
190
14
171
 0.9
0.9
15
37
8
 14
14
238
19
444
 29
29
496
15
554
 9
9
160
10
150
 4
4
69
42
60
 3
3
53
12
59
 27
27
475
83
493
 2
2
36
12
15
 2
2
33
7
37
 2
2
37
9
44
 1.3
1.3
23
8
19
 0.5
0.5
9
96
18
 3
3
54
6
58
 3
3
59
43
37
 12
12
215
56
252
 2
2
33
8
46
 1.4
1.4
24
11
28
 3
3
56
2
11
 4
4
67
6
78
 1.3
1.3
22
9
27
 21
21
370
23
424
 2
2
34
15
22
 3
3
49
6
52
 2
2
29
8
31
 19
19
336
14
109
 51
51
890
18
640
 100
100
1729
21
2401
 2
2
34
48
112
 30
30
512
26
439
 2
2
36
22
23
Evolution
Species Conservation
PhosphoNET % Identity:
PhosphoNET % Similarity:
Homologene %
Identity:
PhosphoNET % Identity:
PhosphoNET % Similarity:
Homologene %
Identity:
 100
100
100
100 99.4
99.4
99.4
99 85.5
85.5
86.4
97 -
-
-
74 -
-
-
- 78.5
78.5
83.6
84 -
-
-
- 65.4
65.4
71.8
75 71.1
71.1
78.9
74 -
-
-
- -
-
-
- 62.2
62.2
72.8
63 53.8
53.8
66.6
56 46.5
46.5
62.1
52 -
-
-
- -
-
-
30 -
-
-
- 20.2
20.2
36.1
- 26.3
26.3
40.7
- -
-
-
- 29.6
29.6
43.2
- -
-
-
- 22.8
22.8
42
- -
-
-
- -
-
-
-
For a wider analysis go to PhosphoNET Evolution in PhosphoNET
Binding Proteins
Examples of known interacting proteins
hiddentext
| No. | Name – UniProt ID |
|---|---|
| 1 | HSPA1A - P08107 |
| 2 | MYOD1 - P15172 |
| 3 | BMPR2 - Q13873 |
| 4 | FYN - P06241 |
Regulation
Activation:
Activated by phosphorylation at Ser-3.
Inhibition:
Inhibited by phosphorylation at Ser-102.
Synthesis:
NA
Degradation:
NA
Known Upstream Kinases
For further details on these substrates click on the Substrate Short Name or UniProt ID. Phosphosite Location is hyperlinked to PhosphoNET
predictions.
Based on in vitro and/or in vivo phosphorylation data
| Kinase Short Name | UniProt ID (Human) | Phosphosite Location | Phosphosite Sequence | Effect of Phosphorylation |
|---|
Known Downstream Substrates
For further details on these substrates click on the Substrate Short Name or UniProt ID. Phosphosite Location is hyperlinked to PhosphoNET
predictions.
Based on in vitro and/or in vivo phosphorylation data
| Substrate Short Name | UniProt ID (Human) | Phosphosite Location | Phosphosite Sequence | Effect of Phosphorylation |
|---|
Protein Kinase Specificity
Matrix of observed frequency (%) of amino acids in aligned protein substrate phosphosites
Matrix Type:
Predicted from the application of the Kinexus Kinase Substrate Predictor Version 2.0 algorithm, which was trained with over 10,000 kinase-protein substrate pairs and 8,000 kinase-peptide substrate pairs.
Domain #:
1
Disease Linkage
Comments:
Mos was originally identified as an oncoprotein from avial retroviral studies. It can function as a director activator of the MEK>ERK signalling cascade through phosphorylation of MEK1 and MEK2. However, there is little evidence that it functions as an oncoprotein in human cancers.
Gene Expression in Cancers:
TranscriptoNET (www.transcriptonet.ca) analysis with mRNA expression data retrieved from the National Center for Biotechnology Information's Gene Expression Omnibus (GEO) database, which was normalized against 60 abundantly and commonly found proteins, indicated altered expression for this protein kinase as shown here as the percent change from normal tissue controls (%CFC) as supported with the Student T-test in human Bladder carcinomas (%CFC= -47, p<0.002). The COSMIC website notes an up-regulated expression score for MOS in diverse human cancers of 193, which is 58% lower than the average score of 462 for the human protein kinases. The down-regulated expression score of 0 for this protein kinase in human cancers was 100% lower than average score of 60 for the human protein kinases.
Mutagenesis Experiments:
Insertional mutagenesis studies in mice have not yet revealed a role for this protein kinase in mouse cancer oncogenesis.
Mutation Rate in All Cancers:
Percent mutation rates per 100 amino acids length in human cancers: 0.13 % in 25371 diverse cancer specimens. This rate is 1.8-fold higher than the average rate of 0.075 % calculated for human protein kinases in general.
Mutation Rate in Specific Cancers:
Highest percent mutation rates per 100 amino acids length in human cancers: 0.88 % in 589 stomach cancers tested; 0.86 % in 1270 large intestine cancers tested; 0.34 % in 603 endometrium cancers tested; 0.33 % in 864 skin cancers tested; 0.26 % in 548 urinary tract cancers tested; 0.19 % in 1956 lung cancers tested; 0.19 % in 1512 liver cancers tested; 0.16 % in 710 oesophagus cancers tested; 0.08 % in 1467 pancreas cancers tested; 0.06 % in 891 ovary cancers tested; 0.06 % in 1490 breast cancers tested; 0.05 % in 558 thyroid cancers tested.
Frequency of Mutated Sites:
None > 5 in 20,654 cancer specimens
Comments:
About 25% of the point mutations are silent and do not change the amino acid sequence of the protein kinase. Broad distribution of point mutations, but no complex mutations, deletions or insertions.