
Nomenclature
Short Name:
MSK2
Full Name:
Ribosomal protein S6 kinase alpha 4
Alias:
- EC 2.7.11.1
- Kinase MSK2
- RSK-B
- Similar to ribosomal protein S6 kinase, 90kD, polypeptide 4
- Similar to ribosomal protein S6 kinase, polypeptide 4
- KS6A4
- Ribosomal protein kinase B
- Ribosomal protein S6 kinase, 90kDa, polypeptide 4
- RPS6KA4
Classification
Type:
Protein-serine/threonine kinase
Group:
AGC
Family:
RSK
SubFamily:
MSK

Specific Links
Structure
Mol. Mass (Da):
85,606
# Amino Acids:
772
# mRNA Isoforms:
2
mRNA Isoforms:
85,606 Da (772 AA; O75676); 84,884 Da (766 AA; O75676-2)
4D Structure:
Forms a complex with either ERK1 or ERK2 in quiescent cells which transiently dissociates following mitogenic stimulation. Also associates with MAPK14/p38-alpha. Activated RPS6KA4 associates with and phosphorylates the NF-kappa-B p65 subunit RELA
1D Structure:
Subfamily Alignment
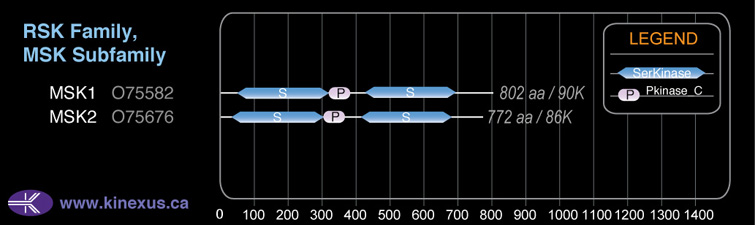
Domain Distribution:
Kinexus Products
Click on entries below for direct links to relevant products from Kinexus for this protein kinase.
hiddentext
Post-translation Modifications
For detailed information on phosphorylation of this kinase go to PhosphoNET
Serine phosphorylated:
S29, S196+, S324, S343+, S347+, S360+, S365+, S634, S678, S681, S682, S721, S737, S745, S772.
Threonine phosphorylated:
T22, T41, T194, T376, T542, T568+, T687+.
Tyrosine phosphorylated:
Y44, Y141, Y342, Y359.
Ubiquitinated:
K37, K191, K440, K532, K548, .
Distribution
Based on gene microarray analysis from the NCBI
Human Tissue Distribution
% Max Expression:
Mean Expression:
Number of Samples:
Standard Deviation:
% Max Expression:
Mean Expression:
Number of Samples:
Standard Deviation:
 88
88
1159
22
1101
 8
8
103
11
108
 11
11
143
17
127
 25
25
336
89
553
 45
45
594
22
570
 14
14
180
54
374
 18
18
236
29
528
 61
61
802
38
1506
 26
26
342
10
295
 13
13
174
84
286
 11
11
147
30
226
 48
48
639
117
702
 12
12
153
28
102
 7
7
90
9
84
 7
7
90
10
72
 4
4
56
13
59
 6
6
76
119
64
 9
9
116
24
107
 7
7
96
77
93
 35
35
459
84
422
 10
10
128
26
113
 9
9
119
28
94
 49
49
643
18
2292
 5
5
60
24
73
 10
10
136
26
132
 100
100
1323
64
2969
 8
8
108
31
84
 43
43
572
24
2206
 7
7
97
24
97
 40
40
526
28
498
 83
83
1096
18
715
 39
39
511
26
675
 57
57
757
67
1032
 49
49
650
52
570
 6
6
73
35
62
Evolution
Species Conservation
PhosphoNET % Identity:
PhosphoNET % Similarity:
Homologene %
Identity:
PhosphoNET % Identity:
PhosphoNET % Similarity:
Homologene %
Identity:
 100
100
100
100 85.5
85.5
85.7
100 98.7
98.7
99
99 -
-
-
95 -
-
-
- 96.8
96.8
98.1
97 -
-
-
- 95.9
95.9
96.8
96 41.3
41.3
60.6
96 -
-
-
- 56.1
56.1
71.6
- 64
64
78.5
- 41.1
41.1
59.1
68 42
42
60.4
72 -
-
-
- 27
27
38.9
- 45.2
45.2
60.1
- 48.2
48.2
64.4
49 48.3
48.3
61.9
- -
-
-
- -
-
-
- -
-
-
- 20.5
20.5
35.6
- 21.2
21.2
37.6
- -
-
-
-
For a wider analysis go to PhosphoNET Evolution in PhosphoNET
Binding Proteins
Examples of known interacting proteins
hiddentext
| No. | Name – UniProt ID |
|---|---|
| 1 | MAPK14 - Q16539 |
| 2 | CREB1 - P16220 |
| 3 | ATF1 - P18846 |
| 4 | MAP2K1 - Q02750 |
| 5 | MAPK1 - P28482 |
| 6 | HMGN1 - P05114 |
| 7 | FOS - P01100 |
| 8 | MAPK3 - P27361 |
Regulation
Activation:
Activated by phosphorylation at Ser-196, Ser-343, Ser-347, Thr-360, Thr-568 and Thr-687.
Inhibition:
NA
Synthesis:
NA
Degradation:
NA
Known Upstream Kinases
For further details on these substrates click on the Substrate Short Name or UniProt ID. Phosphosite Location is hyperlinked to PhosphoNET
predictions.
Based on in vitro and/or in vivo phosphorylation data
| Kinase Short Name | UniProt ID (Human) | Phosphosite Location | Phosphosite Sequence | Effect of Phosphorylation |
|---|
| MSK2 | O75676 | S196 | EEKERTFSFCGTIEY | + |
| p38a | Q16539 | S196 | EEKERTFSFCGTIEY | + |
| ERK2 | P28482 | S343 | TRLEPVYSPPGSPPP | + |
| ERK1 | P27361 | S343 | TRLEPVYSPPGSPPP | + |
| p38a | Q16539 | S343 | TRLEPVYSPPGSPPP | + |
| p38a | Q16539 | S347 | PVYSPPGSPPPGDPR | + |
| p38a | Q16539 | S360 | PRIFQGYSFVAPSIL | + |
| MSK2 | O75676 | S360 | PRIFQGYSFVAPSIL | + |
| MSK2 | O75676 | S365 | GYSFVAPSILFDHNN | + |
| p38a | Q16539 | T568 | SPGVPMQTPCFTLQY | + |
| ERK2 | P28482 | T568 | SPGVPMQTPCFTLQY | + |
| ERK1 | P27361 | T568 | SPGVPMQTPCFTLQY | + |
| ERK2 | P28482 | T687 | RSSPPLRTPDVLESS | + |
| ERK1 | P27361 | T687 | RSSPPLRTPDVLESS | + |
| p38a | Q16539 | T687 | RSSPPLRTPDVLESS | + |
Known Downstream Substrates
For further details on these substrates click on the Substrate Short Name or UniProt ID. Phosphosite Location is hyperlinked to PhosphoNET
predictions.
Based on in vitro and/or in vivo phosphorylation data
| Substrate Short Name | UniProt ID (Human) | Phosphosite Location | Phosphosite Sequence | Effect of Phosphorylation |
|---|
| ATF1 | P18846 | S63 | GILARRPSYRKILKD | + |
| CREB1 | P16220 | S133 | EILSRRPSYRKILND | + |
| H3.1 | P68431 | S11 | TKQTARKSTGGKAPR | + |
| H3.1 | P68431 | S29 | ATKAARKSAPATGGV | + |
| H3.3 | P84243 | S10 | TKQTARKSTGGKAPR | |
| H3.3 | P84243 | S28 | ATKAARKSAPSTGGV | |
| MSK2 (RPS6KA4) | O75676 | S196 | EEKERTFSFCGTIEY | + |
| MSK2 (RPS6KA4) | O75676 | S360 | PRIFQGYSFVAPSIL | + |
| MSK2 (RPS6KA4) | O75676 | S365 | GYSFVAPSILFDHNN | + |
| MSK2 (RPS6KA4) | O75676 | S737 | RRKQKLRSATASRRG | |
| MSK2 (RPS6KA4) | O75676 | S745 | ATASRRGSPAPANPG | |
| NFkB-p65 (RELA) | Q04206 | S276 | SMQLRRPSDRELSEP |
Protein Kinase Specificity
Matrix of observed frequency (%) of amino acids in aligned protein substrate phosphosites
Matrix Type:
Predicted from the application of the Kinexus Kinase Substrate Predictor Version 2.0 algorithm, which was trained with over 10,000 kinase-protein substrate pairs and 8,000 kinase-peptide substrate pairs.
Domain #:
2
Inhibitors
For further details on these inhibitors click on the Compound Name and enter it into DrugKiNET or click on the ID's
Based on in vitro and/or in vivo phosphorylation data
| Compound Name | KD, Ki or IC50 (nM) | PubChem ID | ChEMBL ID | PubMed ID |
|---|
Disease Linkage
General Disease Association:
Cancer
Specific Cancer Types:
Breast cancer; Prostate cancer
Comments:
Aberrant activation of members of the family have found to be linked with many human diseases, such as breast and prostate cancers
Gene Expression in Cancers:
TranscriptoNET (www.transcriptonet.ca) analysis with mRNA expression data retrieved from the National Center for Biotechnology Information's Gene Expression Omnibus (GEO) database, which was normalized against 60 abundantly and commonly found proteins, indicated altered expression for this protein kinase as shown here as the percent change from normal tissue controls (%CFC) as supported with the Student T-test in the following types of human cancers: Brain oligodendrogliomas (%CFC= +168, p<0.071); Clear cell renal cell carcinomas (cRCC) stage I (%CFC= -91, p<0.0001); Lung adenocarcinomas (%CFC= +49, p<0.0008); Skin melanomas - malignant (%CFC= +74, p<0.011); Skin squamous cell carcinomas (%CFC= +103, p<0.013); and T-cell prolymphocytic leukemia (%CFC= +100, p<0.016). The COSMIC website notes an up-regulated expression score for MSK2 in diverse human cancers of 489, which is close to the average score of 462 for the human protein kinases. The down-regulated expression score of 44 for this protein kinase in human cancers was 0.7-fold of the average score of 60 for the human protein kinases.
Mutagenesis Experiments:
Insertional mutagenesis studies in mice have not yet revealed a role for this protein kinase in mouse cancer oncogenesis. A F709A substitution is associated with strongly elevated basal phosphotransferase activity.
Mutation Rate in All Cancers:
Percent mutation rates per 100 amino acids length in human cancers: 0.05 % in 25427 diverse cancer specimens. This rate is only -39 % lower than the average rate of 0.075 % calculated for human protein kinases in general.
Mutation Rate in Specific Cancers:
Highest percent mutation rates per 100 amino acids length in human cancers: 0.32 % in 1093 large intestine cancers tested; 0.27 % in 805 skin cancers tested; 0.08 % in 1941 lung cancers tested.
Frequency of Mutated Sites:
Most frequent mutations with the number of reports indicated in brackets: V268M (5).
Comments:
Only 4 deletions, and no insertions or complex mutations are noted on the COSMIC website.