
Nomenclature
Short Name:
PAK3
Full Name:
Serine-threonine-protein kinase PAK 3
Alias:
- Beta-PAK
- P65-PAK
- PAKB
- STK4
- CDC42,RAC effector kinase PAK-B
- EC 2.7.1.
- EC 2.7.11.1
- Oligophrenin-3
- OPHN3
Classification
Type:
Protein-serine/threonine kinase
Group:
STE
Family:
STE20
SubFamily:
PAKA

Specific Links
Structure
Mol. Mass (Da):
62,310
# Amino Acids:
559
# mRNA Isoforms:
4
mRNA Isoforms:
64,530 Da (580 AA; O75914-3); 62,913 Da (565 AA; O75914-4); 62,310 Da (559 AA; O75914); 60,693 Da (544 AA; O75914-2)
4D Structure:
Interacts tightly with GTP-bound but not GDP-bound CDC42/p21 and RAC1. Shows highly specific binding to the SH3 domains of phospholipase C-gamma and of adapter protein NCK.
1D Structure:
Subfamily Alignment
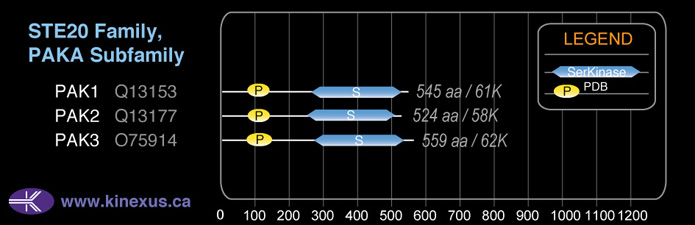
Domain Distribution:
Kinexus Products
Click on entries below for direct links to relevant products from Kinexus for this protein kinase.
hiddentext
Post-translation Modifications
For detailed information on phosphorylation of this kinase go to PhosphoNET
Acetylated:
K257, K269, K433, K535 (N6).
Serine phosphorylated:
S50, S154+, S259, S275, S435+, S558.
Threonine phosphorylated:
T59, T218, T428, T436+, T440.
Tyrosine phosphorylated:
Y217, Y298, Y477.
Ubiquitinated:
K58, K62, K124, K433, K526, K535.
Distribution
Based on gene microarray analysis from the NCBI
Human Tissue Distribution
% Max Expression:
Mean Expression:
Number of Samples:
Standard Deviation:
% Max Expression:
Mean Expression:
Number of Samples:
Standard Deviation:
 56
56
736
16
1049
 12
12
152
12
241
 4
4
50
11
67
 43
43
567
73
640
 51
51
671
14
603
 6
6
74
42
118
 31
31
405
27
441
 100
100
1312
39
3891
 15
15
197
10
181
 6
6
79
82
241
 5
5
66
32
159
 29
29
382
154
620
 4
4
49
27
58
 8
8
106
12
182
 11
11
144
22
308
 16
16
212
12
329
 2
2
20
286
53
 9
9
114
23
262
 5
5
70
77
155
 40
40
521
58
541
 4
4
47
34
105
 2
2
24
29
36
 3
3
42
15
45
 13
13
167
27
338
 3
3
39
34
88
 69
69
907
48
2050
 4
4
58
25
129
 8
8
106
22
218
 18
18
242
24
887
 25
25
332
14
102
 41
41
533
18
389
 73
73
958
29
1623
 0.2
0.2
2
17
1
 70
70
924
26
801
 10
10
132
22
99
Evolution
Species Conservation
PhosphoNET % Identity:
PhosphoNET % Similarity:
Homologene %
Identity:
PhosphoNET % Identity:
PhosphoNET % Similarity:
Homologene %
Identity:
 100
100
100
100 100
100
100
100 93.8
93.8
95.9
- -
-
-
100 -
-
-
99 99.1
99.1
99.5
99 -
-
-
- 98.6
98.6
99.1
99 96.1
96.1
96.6
99 -
-
-
- -
-
-
- 93.6
93.6
95.2
96 93.8
93.8
95.9
95 78.2
78.2
83.4
- -
-
-
- 33
33
50.9
- -
-
-
- 50.9
50.9
65
- -
-
-
- -
-
-
- -
-
-
- -
-
-
- -
-
-
- 31.6
31.6
43.2
- 30.9
30.9
44
-
For a wider analysis go to PhosphoNET Evolution in PhosphoNET
Regulation
Activation:
Activated by binding the small G proteins CDC42 or RAC1. Binding of one of these G proteins to the autoregulatory region releases monomers from the autoinhibited dimer, enables phosphorylation of Thr-436 in the kinase activation loop and allows the kinase domain to adopt an active structure. Also activated by phosphorylation at Ser-154 through autophosphorylation.
Inhibition:
NA
Synthesis:
NA
Degradation:
NA
Known Upstream Kinases
For further details on these substrates click on the Substrate Short Name or UniProt ID. Phosphosite Location is hyperlinked to PhosphoNET
predictions.
Based on in vitro and/or in vivo phosphorylation data
| Kinase Short Name | UniProt ID (Human) | Phosphosite Location | Phosphosite Sequence | Effect of Phosphorylation |
|---|
Known Downstream Substrates
For further details on these substrates click on the Substrate Short Name or UniProt ID. Phosphosite Location is hyperlinked to PhosphoNET
predictions.
Based on in vitro and/or in vivo phosphorylation data
| Substrate Short Name | UniProt ID (Human) | Phosphosite Location | Phosphosite Sequence | Effect of Phosphorylation |
|---|
| Caldesmon | Q05682 | S714 | EGVRNIKSMWEKGNV | |
| Caldesmon | Q05682 | S744 | GLKVGVSSRINEWLT | |
| Cortactin | Q14247 | S113 | SKLSKHCSQVDSVRG | |
| Cortactin | Q14247 | S150 | GKTEKHASQKDYSSG | |
| Cortactin | Q14247 | S282 | VQSERQDSAAVGFDY | |
| ERK3 (MAPK6) | Q16659 | S189 | YSHKGHLSEGLVTKW | + |
| ERK4 (MAPK4) | P31152 | S186 | YSHKGYLSEGLVTKW | + |
| MEK1 (MAP2K1) | Q02750 | S298 | RTPGRPLSSYGMDSR | + |
| MRLC2 (MYL12B) | P19105 | S2 | _______SSKRTKTK | + |
| MRLC2 (MYL12B) | P19105 | S20 | KRPQRATSNVFAMFD | |
| MRLC2 (MYL12B) | P19105 | S3 | ______SSKRTKTKT | + |
| MYO6 | Q9UM54 | T405 | TAGGTKGTVIKVPLK | |
| PAK3 | O75914 | S154 | VNNQKYMSFTSGDKS | + |
| PAK3 | O75914 | S50 | NKKARLRSIFPGGGD | ? |
| PAK3 | O75914 | T436 | PEQSKRSTMVGTPYW | + |
| Raf1 | P04049 | S338 | RPRGQRDSSYYWEIE | + |
| SYN1 | P17600 | S551 | PAARPPASPSPQRQA | |
| SYN1 | P17600 | S605 | AGPTRQASQAGPVPR | |
| SYN1 | P17600 | S9 | NYLRRRLSDSNFMAN |
Protein Kinase Specificity
Matrix of observed frequency (%) of amino acids in aligned protein substrate phosphosites
Matrix Type:
Predicted from the application of the Kinexus Kinase Substrate Predictor Version 2.0 algorithm, which was trained with over 10,000 kinase-protein substrate pairs and 8,000 kinase-peptide substrate pairs.
Domain #:
1
Inhibitors
For further details on these inhibitors click on the Compound Name and enter it into DrugKiNET or click on the ID's
Based on in vitro and/or in vivo phosphorylation data
| Compound Name | KD, Ki or IC50 (nM) | PubChem ID | ChEMBL ID | PubMed ID |
|---|
Disease Linkage
Gene Expression in Cancers:
TranscriptoNET (www.transcriptonet.ca) analysis with mRNA expression data retrieved from the National Center for Biotechnology Information's Gene Expression Omnibus (GEO) database, which was normalized against 60 abundantly and commonly found proteins, indicated altered expression for this protein kinase as shown here as the percent change from normal tissue controls (%CFC) as supported with the Student T-test in the following types of human cancers: Bladder carcinomas (%CFC= -52, p<0.0005); Breast epithelial carcinomas (%CFC= -71, p<0.077); Breast epithelial hyperplastic enlarged lobular units (HELU) (%CFC= -67, p<0.007); Papillary thyroid carcinomas (PTC) (%CFC= -54, p<0.014); Skin melanomas - malignant (%CFC= -51, p<0.008); Skin squamous cell carcinomas (%CFC= -56, p<0.015); Uterine leiomyomas from fibroids (%CFC= +139, p<0.033). The COSMIC website notes an up-regulated expression score for PAK3 in diverse human cancers of 541, which is 1.2-fold of the average score of 462 for the human protein kinases. The down-regulated expression score of 39 for this protein kinase in human cancers was 0.7-fold of the average score of 60 for the human protein kinases.
Mutagenesis Experiments:
Insertional mutagenesis studies in mice support a role for this protein kinase in mouse cancer oncogenesis.
Mutation Rate in All Cancers:
Percent mutation rates per 100 amino acids length in human cancers: 0.11 % in 25471 diverse cancer specimens. This rate is a modest 1.52-fold higher than the average rate of 0.075 % calculated for human protein kinases in general.
Mutation Rate in Specific Cancers:
Highest percent mutation rates per 100 amino acids length in human cancers: 0.59 % in 1184 large intestine cancers tested; 0.47 % in 805 skin cancers tested; 0.39 % in 602 endometrium cancers tested; 0.27 % in 1941 lung cancers tested.
Frequency of Mutated Sites:
Most frequent mutations with the number of reports indicated in brackets: E18D2 (3).
Comments:
Only 1 deletion, and no insertions or complex mutations are noted on the COSMIC website.