
Nomenclature
Short Name:
FGFR3
Full Name:
Fibroblast growth factor receptor 3
Alias:
- ACH
- Heparin-binding growth factor receptor
- JTK4
- Kinase FGFR3
- SAM3; HSFGFR3E
- CD333
- CEK2
- EC 2.7.10.1
- FGFR-3
- Fibroblast growth factor receptor 3
Classification
Type:
Protein-tyrosine kinase
Group:
TK
Family:
FGFR
SubFamily:
NA

Specific Links
Structure
Mol. Mass (Da):
87,710
# Amino Acids:
806
# mRNA Isoforms:
4
mRNA Isoforms:
88,157 Da (808 AA; P22607-2); 87,710 Da (806 AA; P22607); 85,083 Da (791 AA; P22607-4); 75,696 Da (694 AA; P22607-3)
4D Structure:
NA
1D Structure:
3D Image (rendered using PV Viewer):
PDB ID
Subfamily Alignment
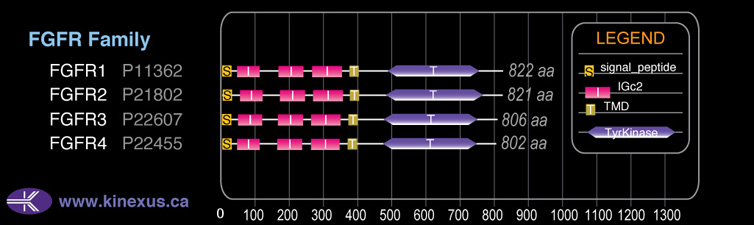
Domain Distribution:
Kinexus Products
Click on entries below for direct links to relevant products from Kinexus for this protein kinase.
hiddentext
Post-translation Modifications
For detailed information on phosphorylation of this kinase go to PhosphoNET
Acetylated:
K530.
N-GlcNAcylated:
N98, N225, N262, N294, N315, N328.
Serine phosphorylated:
S408, S444, S445, S524, S578, S596, S787.
Threonine phosphorylated:
T777.
Tyrosine phosphorylated:
Y577, Y599, Y607, Y647+, Y648+, Y724+, Y760+, Y770.
Ubiquitinated:
K632.
Distribution
Based on gene microarray analysis from the NCBI
Human Tissue Distribution
% Max Expression:
Mean Expression:
Number of Samples:
Standard Deviation:
% Max Expression:
Mean Expression:
Number of Samples:
Standard Deviation:
 61
61
1006
29
1678
 1
1
19
14
18
 18
18
299
30
764
 36
36
594
109
606
 29
29
484
24
483
 14
14
226
77
323
 17
17
277
31
454
 43
43
715
58
1635
 38
38
637
17
577
 13
13
208
101
202
 12
12
204
49
338
 34
34
556
190
607
 7
7
122
52
303
 0.7
0.7
11
11
9
 26
26
424
43
556
 3
3
47
15
68
 11
11
177
139
979
 6
6
102
38
184
 2
2
28
105
45
 65
65
1083
109
858
 25
25
420
41
421
 9
9
157
45
334
 10
10
158
48
172
 9
9
141
39
186
 9
9
155
40
275
 36
36
598
75
1459
 10
10
171
55
210
 15
15
256
39
317
 12
12
206
39
510
 6
6
95
28
90
 17
17
287
24
286
 100
100
1656
42
3065
 36
36
588
105
1002
 36
36
592
62
610
 38
38
625
44
1480
Evolution
Species Conservation
PhosphoNET % Identity:
PhosphoNET % Similarity:
Homologene %
Identity:
PhosphoNET % Identity:
PhosphoNET % Similarity:
Homologene %
Identity:
 100
100
100
100 67.3
67.3
77.5
96 99.1
99.1
99.3
99 -
-
-
92.5 -
-
-
96 89.3
89.3
92
91 -
-
-
- 92.4
92.4
94.8
93 62.9
62.9
76.3
93 -
-
-
- -
-
-
- 80.2
80.2
87.6
81 70.6
70.6
79.4
75 73.8
73.8
82.4
78 -
-
-
- 37.6
37.6
54.1
46 -
-
-
- 31.4
31.4
46.6
44 35.5
35.5
50
- -
-
-
- -
-
-
- -
-
-
- -
-
-
- -
-
-
- -
-
-
-
For a wider analysis go to PhosphoNET Evolution in PhosphoNET
Binding Proteins
Examples of known interacting proteins
hiddentext
| No. | Name – UniProt ID |
|---|---|
| 1 | FGF7 - P21781 |
| 2 | KGFLP2 - Q2TVT3 |
| 3 | FGF6 - P10767 |
| 4 | KGFLP1 - Q2TVT4 |
| 5 | FGF4 - P08620 |
| 6 | FGF5 - P12034 |
| 7 | FGF2 - P09038 |
| 8 | FGF23 - Q9GZV9 |
| 9 | FGF18 - O76093 |
| 10 | FGF8 - P55075 |
| 11 | STAT3 - P40763 |
| 12 | EPHA4 - P54764 |
| 13 | RNASEH2A - O75792 |
| 14 | KRT8 - P05787 |
Regulation
Activation:
Activated by binding of fibroblast growth factor (FGF), which induces dimerization and autophosphorylation. Phosphorylation of Tyr-724 and Tyr-760 increases phosphotransferase activity and induces interaction with SH2-B-beta.
Inhibition:
NA
Synthesis:
NA
Degradation:
NA
Known Upstream Kinases
For further details on these substrates click on the Substrate Short Name or UniProt ID. Phosphosite Location is hyperlinked to PhosphoNET
predictions.
Based on in vitro and/or in vivo phosphorylation data
| Kinase Short Name | UniProt ID (Human) | Phosphosite Location | Phosphosite Sequence | Effect of Phosphorylation |
|---|
Known Downstream Substrates
For further details on these substrates click on the Substrate Short Name or UniProt ID. Phosphosite Location is hyperlinked to PhosphoNET
predictions.
Based on in vitro and/or in vivo phosphorylation data
| Substrate Short Name | UniProt ID (Human) | Phosphosite Location | Phosphosite Sequence | Effect of Phosphorylation |
|---|
| FGFR3 | P22607 | Y647 | RDVHNLDYYKKTTNG | + |
| FGFR3 | P22607 | Y648 | DVHNLDYYKKTTNGR | + |
| FGFR3 | P22607 | Y724 | ANCTHDLYMIMRECW | + |
| FGFR3 | P22607 | Y760 | TVTSTDEYLDLSAPF | + |
| PTEN | P60484 | Y240 | RREDKFMYFEFPQPL | + |
| RSK2 (RPS6KA3) | P51812 | Y488 | DVYDDGKYVYVVTEL | |
| RSK2 (RPS6KA3) | P51812 | Y529 | TITKTVEYLHAQGVV | ? |
| STAT1 | P42224 | Y701 | DGPKGTGYIKTELIS | + |
Protein Kinase Specificity
Matrix of observed frequency (%) of amino acids in aligned protein substrate phosphosites
Matrix Type:
Experimentally derived from alignment of 6 known protein substrate phosphosites and 100 peptides phosphorylated by recombinant FGFR3 in vitro tested in-house by Kinexus.
Domain #:
1
Inhibitors
For further details on these inhibitors click on the Compound Name and enter it into DrugKiNET or click on the ID's
Based on in vitro and/or in vivo phosphorylation data
| Compound Name | KD, Ki or IC50 (nM) | PubChem ID | ChEMBL ID | PubMed ID |
|---|
Disease Linkage
General Disease Association:
Cancer, bone disorders
Specific Diseases (Non-cancerous):
Achondroplasia; Hypochondroplasia; Muenke syndrome; Ladd syndrome; Craniosynostosis; Thanatophoric dysplasia; Epidermal nevus, somatic; Keratosis, seborrheic, somatic; Skeletal dysplasias; Dwarfism; Thanatophoric dysplasia Type 1; Saethre-Chotzen syndrome; Crouzonodermoskeletal syndrome; Thanatophoric dysplasia Type 2; Camptodactyly, tall stature, and hearing loss syndrome; Acanthosis nigricans; Crouzon syndrome; Keratosis; Synostosis; Cherubism; Strabismus; Saddan; Beare-Stevenson Cutis Gyrata syndrome; FGFR-related craniosynostosis syndromes; Nevus sebaceous, somatic; FGFR3-related craniosynostosis; Epidermal nevus; Dermatosis papulosa nigra; Skeletal dysplasia, San Diego Type; Acrocephalosyndactylia; Jackson-Weiss syndrome; Osteoglophonic dysplasia; Polyhydramnios; Osteogenesis imperfecta, Type 1I; Seborrheic keratosis; Plagiocephaly; Radioulnar synostosis; Astigmatism; Craniosynostosis, Type 1; Craniosynostosis 4; Craniosynostosis 3; FGFR3-related isolated coronal synostosis; FGFR3-related lacrimo-auriculo-dento-digital syndrome
Comments:
Achondroplasia is a bone disease that is characterized by the failed conversion of cartilage into bone during skeletal development. Symptoms of this disease include dwarfism, limited range of motion at the joints, large-size head, small fingers, and normal intelligence. Hypochondroplasia is a type of dwarfism that is also characterized by the failure of cartilage to be converted into bone during development. Hypochondroplasia is similar to achondroplasia, but the symptoms are milder. Hypochondroplasia is inherited in an autosomal dominant manner. Various mutations in the FGFR3 gene are associated with achondroplasia and hypochondroplasia, with the most common being a G380R substitution mutation. Affected individuals have epiphyseal growth plates of their long bones that are abnormal organized, are hypocellular, and display aberrant chondrocyte maturation and development. In vitro and in vivo studies have concluded that FGFR3 acts as an inhibitory factor for chondrocyte proliferation and maturation. Gain-of-function mutations resulting in enhanced kinase catalytic activity of the EGFR3 protein are hypothesized to be the cause of achondroplasia and hypochondroplasia, due to the excessive suppression of chondrocyte proliferation and maturation by the overactive EGFR3 protein. Abnormal EGFR3 activity may have a role in the pathogenesis of achondroplasia and hypochondroplasia.
Specific Cancer Types:
Bladder cancer, somatic; Myelomas; Bladder carcinomas; Papilloma; Osteochondromas; Bladder cancer susceptibility; Colorectal cancer; Cervical cancer; Germ cell tumours; Monoclonal gammopathy of uncertain significance; Spermatocytic seminomas, somatic; Bladder transitional cell papillomas; Cervical cancer, somatic; Gliosarcomas; Giant cell glioblastomas; Male germ cell tumours, somatic; Colorectal cancer, somatic; Testicular tumours, somatic
Comments:
FGFR3 is a known oncoprotein (OP). Cancer-related mutations in human tumours point to a gain of function of the protein kinase. The active form of the protein kinase normally acts to promote tumour cell proliferation. Mutations in the FGFR3 gene that result in overactive or constitutive kinase phosphotransferase activity have been associated with several cancer types as they cause aberrant cell proliferation and differentiation as well as reduced apoptosis. For example, ectopic activation of the FGFR3 protein has been observed in multiple myeloma cancer specimens. Furthermore, dysregulated FGFR3 activity has been observed in 14. 5% of bone marrow samples from patients with multiple myeloma In particular, the multiple myeloma phenotype and progression of the cancer has been associated with the abnormal interaction between FGFR3 and the regulatory subunit of PI3K (P1K3R1). Short interferring RNA (siRNA)-mediated knockdown of PIK3R2 in multiple myeloma cancer cell lines results in increased dowstream ERK activity in response to FGF2 stimulation, indicating a tumour suppressive role for the PIK3R2 protein in the inhibition of MAPK signal activation. Furthermore, dysregulation of oncogenes by translocation of the gene sequence to the immunoglobulin heavy chain locus (14q32) is though to be a primary event in the development of B-cell tumours. Chromosome 4 breakpoints involved in the tumorigenesis of multiple myeloma are concentrated in the 70 kb region ~100 kb centromeric to the FGFR3 gene, indicating that the FGFR3 gene is translocated and contributes to the development of multiple myeloma. This translocation was observed in 3-24% of different groups of multiple myeloma cancer cell lines. In addition, the resultant FGFR3 protein produced by this translocation is predicted to display consitutive kinase catalytic activity, even in the absence of ligands, indicating that the translocation results in oncogenic FGFR3 activity. Mutations in the FGFR3 gene have also been associated with colon cancer, including a E322L substitution mutation in a highly conserved residue (the Glu322 residue is conserved from yeast to human), and a 1-bp deletion mutation (849delC) in exon 7 of the gene which causes a frameshift mutation resulting in the production of a truncated FGFR3 protein.
Gene Expression in Cancers:
TranscriptoNET (www.transcriptonet.ca) analysis with mRNA expression data retrieved from the National Center for Biotechnology Information's Gene Expression Omnibus (GEO) database, which was normalized against 60 abundantly and commonly found proteins, indicated altered expression for this protein kinase as shown here as the percent change from normal tissue controls (%CFC) as supported with the Student T-test in the following types of human cancers: Barrett's esophagus epithelial metaplasia (%CFC= -68, p<0.022); Bladder carcinomas (%CFC= +247, p<0.014); Ovary adenocarcinomas (%CFC= +165, p<0.068); Skin melanomas - malignant (%CFC= -95, p<0.017); Uterine fibroids (%CFC= -66, p<0.012); and Uterine leiomyomas (%CFC= +430, p<0.02). The COSMIC website notes an up-regulated expression score for FGFR3 in diverse human cancers of 406, which is 0.9-fold of the average score of 462 for the human protein kinases. The down-regulated expression score of 0 for this protein kinase in human cancers was 100% lower than the average score of 60 for the human protein kinases.
Mutagenesis Experiments:
Insertional mutagenesis studies in mice have not yet revealed a role for this protein kinase in mouse cancer oncogenesis.
Mutation Rate in All Cancers:
Percent mutation rates per 100 amino acids length in human cancers: 1.08 % in 40934 diverse cancer specimens. This rate is 14.4-fold higher than the average rate of 0.075 % calculated for human protein kinases in general.
Mutation Rate in Specific Cancers:
Highest percent mutation rates per 100 amino acids length in human cancers: 4.87 % in 7248 urinary tract cancers tested; 1.76 % in 2454 skin cancers tested; 0.64 % in 1390 upper aerodigestive tract cancers tested; 0.38 % in 1549 large intestine cancers tested; 0.12 % in 2474 haematopoietic and lymphoid cancers tested; 0.11 % in 1119 prostate cancers tested; 0.06 % in 2909 lung cancers tested.
Frequency of Mutated Sites:
Most frequent mutations with the number of reports indicated in brackets: S249C (1822); Y373C (574); R248C (398); G370C (158); S371C (55); G697C (44): K650E (79); K650M (82). AA 650 and 697 are in the kinase catalytic domain..
Comments:
In human tumours, there are two main clusters of mutations at amino acid resdiues 248-249 and 370-390 with point mutations. insertions and deletions also occur in the first cluster, whereas complex mutations also occur within the second main cluster.