
Nomenclature
Short Name:
BRD2
Full Name:
Bromo domain-containing protein 2
Alias:
- KIAA9001
- O27.1.1
- Protein RING3
- RING3
Classification
Type:
Protein-serine/threonine kinase
Group:
Atypical
Family:
BRD
SubFamily:
NA

Specific Links
Structure
Mol. Mass (Da):
88,061
# Amino Acids:
801
# mRNA Isoforms:
4
mRNA Isoforms:
92,033 Da (836 AA; P25440-2); 88,061 Da (801 AA; P25440); 83,151 Da (754 AA; P25440-3); 74,881 Da (681 AA; P25440-4)
4D Structure:
Homodimer. Interacts with E2F1 and with histone H4 acetylated at 'Lys-13'.
1D Structure:
3D Image (rendered using PV Viewer):
PDB ID
Subfamily Alignment
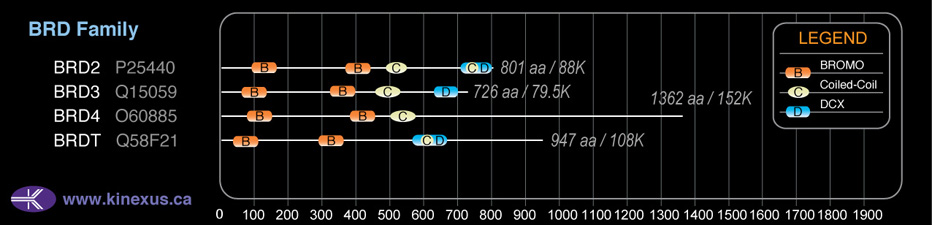
Domain Distribution:
| Start | End | Domain |
|---|---|---|
| 91 | 163 | BROMO |
| 364 | 436 | BROMO |
| 488 | 539 | Coiled-coil |
| 708 | 791 | DUF755 |
| 723 | 752 | Coiled-coil |
| 638 | 801 | ET |
Kinexus Products
Click on entries below for direct links to relevant products from Kinexus for this protein kinase.
hiddentext
Post-translation Modifications
For detailed information on phosphorylation of this kinase go to PhosphoNET
Acetylated:
K10, K31, K342, K614, K617.
Serine phosphorylated:
S37, S45, S50, S248, S253, S298, S301, S305, S320, S334, S340, S341, S538, S608, S611, S633, S651, S705, S744, S749, S775, S777, S778, S779, S784, S785, S786, S787, S788, S789.
Threonine phosphorylated:
T6, T47, T57, T125, T285, T291, T629, T690, T716, T724, T795.
Tyrosine phosphorylated:
Y40, Y450, Y631, Y715.
Distribution
Based on gene microarray analysis from the NCBI
Human Tissue Distribution
% Max Expression:
Mean Expression:
Number of Samples:
Standard Deviation:
% Max Expression:
Mean Expression:
Number of Samples:
Standard Deviation:
 20
20
955
42
776
 8
8
396
24
185
 34
34
1662
15
1850
 20
20
980
150
1318
 25
25
1222
36
876
 11
11
537
119
977
 12
12
603
51
566
 58
58
2826
73
4912
 21
21
1029
24
637
 8
8
391
129
303
 13
13
639
48
1098
 20
20
976
309
891
 20
20
973
48
1770
 5
5
250
21
123
 15
15
740
39
1179
 9
9
429
24
163
 7
7
343
304
665
 16
16
774
30
1115
 7
7
335
135
447
 18
18
896
162
836
 16
16
784
36
1219
 22
22
1090
42
1889
 18
18
893
50
1385
 26
26
1288
30
1692
 22
22
1076
36
1726
 22
22
1054
94
1412
 15
15
736
51
1073
 22
22
1095
30
1531
 20
20
1000
30
1521
 2
2
82
42
54
 21
21
1049
30
893
 58
58
2848
51
7164
 11
11
538
89
662
 20
20
992
98
720
 100
100
4881
48
4750
Evolution
Species Conservation
PhosphoNET % Identity:
PhosphoNET % Similarity:
Homologene %
Identity:
PhosphoNET % Identity:
PhosphoNET % Similarity:
Homologene %
Identity:
 100
100
100
100 96.9
96.9
97.5
99 97.1
97.1
97.4
99 -
-
-
96 -
-
-
98 60.7
60.7
69.2
96 -
-
-
- 96.4
96.4
97.4
96 96.5
96.5
97.3
95 -
-
-
- 40.4
40.4
47.1
- -
-
-
81 -
-
-
74 -
-
-
65 -
-
-
- -
-
-
- -
-
-
- -
-
-
- -
-
-
- -
-
-
- -
-
-
- -
-
-
- 20.2
20.2
29
26 -
-
-
- -
-
-
-
For a wider analysis go to PhosphoNET Evolution in PhosphoNET
Binding Proteins
Examples of known interacting proteins
hiddentext
| No. | Name – UniProt ID |
|---|---|
| 1 | SKP1 - P63208 |
Regulation
Activation:
NA
Inhibition:
NA
Synthesis:
NA
Degradation:
NA
Disease Linkage
General Disease Association:
Epilepsy
Specific Diseases (Non-cancerous):
Photosensitive epilepsy
Comments:
There may be a possible association between variation in the BRD2 gene and juvenile myoclonic epilepsy.
Gene Expression in Cancers:
TranscriptoNET (www.transcriptonet.ca) analysis with mRNA expression data retrieved from the National Center for Biotechnology Information's Gene Expression Omnibus (GEO) database, which was normalized against 60 abundantly and commonly found proteins, indicated altered expression for this protein kinase as shown here as the percent change from normal tissue controls (%CFC) as supported with the Student T-test in the following types of human cancers: Bladder carcinomas (%CFC= +131, p<0.0001); Large B-cell lymphomas (%CFC= +49, p<0.003); Malignant pleural mesotheliomas (MPM) tumours (%CFC= +93, p<0.0002); Ovary adenocarcinomas (%CFC= +66, p<0.094); Prostate cancer - metastatic (%CFC= +46, p<0.0001); Skin fibrosarcomas (%CFC= +95, p<0.005); Skin melanomas - malignant (%CFC= +177, p<0.0001); and Skin squamous cell carcinomas (%CFC= +103, p<0.002).
Mutagenesis Experiments:
Insertional mutagenesis studies in mice have not yet revealed a role for this protein kinase in mouse cancer oncogenesis.
Mutation Rate in All Cancers:
Percent mutation rates per 100 amino acids length in human cancers: 0.07 % in 24455 diverse cancer specimens. This rate is only -13 % lower than the average rate of 0.075 % calculated for human protein kinases in general.
Mutation Rate in Specific Cancers:
Highest percent mutation rates per 100 amino acids length in human cancers: 0.34 % in 555 stomach cancers tested; 0.22 % in 1229 large intestine cancers tested; 0.2 % in 864 skin cancers tested; 0.14 % in 548 urinary tract cancers tested; 0.13 % in 1512 liver cancers tested; 0.09 % in 1608 lung cancers tested.
Frequency of Mutated Sites:
None > 1 in 20,073 cancer specimens
Comments:
Nine deletion, 4 insertions and no complex mutations are noted on the COSMIC website.