
Nomenclature
Short Name:
GRK5
Full Name:
G protein-coupled receptor kinase 5
Alias:
- EC 2.7.11.16
- GPRK5
- G-protein-coupled receptor kinase 5
- Kinase GRK5
Classification
Type:
Protein-serine/threonine kinase
Group:
AGC
Family:
GRK
SubFamily:
GRK

Specific Links
Structure
Mol. Mass (Da):
67,787
# Amino Acids:
590
# mRNA Isoforms:
1
mRNA Isoforms:
67,787 Da (590 AA; P34947)
4D Structure:
NA
1D Structure:
3D Image (rendered using PV Viewer):
PDB ID
Subfamily Alignment
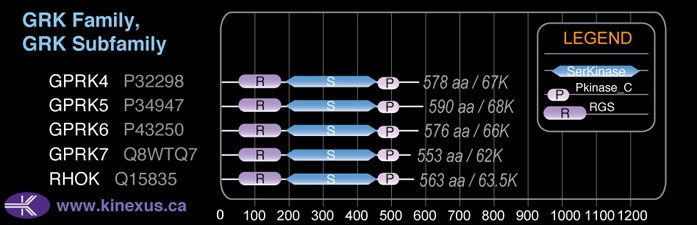
Domain Distribution:
Kinexus Products
Click on entries below for direct links to relevant products from Kinexus for this protein kinase.
hiddentext
Post-translation Modifications
For detailed information on phosphorylation of this kinase go to PhosphoNET
Acetylated:
K24, K26, K28, K29, K226.
Methylated:
K548.
Serine phosphorylated:
S27, S40, S484, S579, S586, S589.
Threonine phosphorylated:
T485.
Tyrosine phosphorylated:
Y408.
Distribution
Based on gene microarray analysis from the NCBI
Human Tissue Distribution
% Max Expression:
Mean Expression:
Number of Samples:
Standard Deviation:
% Max Expression:
Mean Expression:
Number of Samples:
Standard Deviation:
 100
100
977
35
1077
 17
17
168
18
94
 19
19
184
16
128
 26
26
253
126
389
 52
52
508
32
447
 6
6
56
87
76
 33
33
319
45
602
 51
51
500
51
590
 78
78
759
17
570
 7
7
68
98
64
 11
11
109
37
144
 93
93
907
206
677
 14
14
133
38
66
 15
15
149
15
72
 5
5
52
31
50
 12
12
114
21
103
 14
14
132
215
496
 11
11
110
25
116
 11
11
112
97
60
 52
52
506
132
553
 9
9
85
31
55
 26
26
258
35
158
 27
27
260
26
141
 5
5
52
25
48
 14
14
140
31
109
 83
83
810
81
1020
 12
12
113
41
62
 10
10
99
27
58
 14
14
141
27
91
 32
32
309
28
278
 71
71
697
24
585
 63
63
611
41
643
 9
9
84
78
162
 81
81
788
83
717
 14
14
134
48
130
Evolution
Species Conservation
PhosphoNET % Identity:
PhosphoNET % Similarity:
Homologene %
Identity:
PhosphoNET % Identity:
PhosphoNET % Similarity:
Homologene %
Identity:
 100
100
100
100 67.5
67.5
80.2
97 69.5
69.5
82.2
97 -
-
-
97 -
-
-
95 93
93
96
97 -
-
-
- 95.3
95.3
97.5
95 95.1
95.1
97.5
95 -
-
-
- 82.3
82.3
87.9
- 91
91
95.3
91 30
30
44.9
86 71.4
71.4
83.4
- -
-
-
- 53.6
53.6
65.1
65 -
-
-
- 53.3
53.3
68.5
60 -
-
-
- -
-
-
- -
-
-
- -
-
-
- -
-
-
- -
-
-
- -
-
-
-
For a wider analysis go to PhosphoNET Evolution in PhosphoNET
Binding Proteins
Examples of known interacting proteins
hiddentext
| No. | Name – UniProt ID |
|---|---|
| 1 | AGTR1 - P30556 |
| 2 | CHRM2 - P08172 |
| 3 | TBXA2R - P21731 |
| 4 | ADRB2 - P07550 |
| 5 | RHOD - O00212 |
| 6 | RHO - P08100 |
| 7 | TACR1 - P25103 |
| 8 | OXTR - P30559 |
| 9 | AVPR1A - P37288 |
| 10 | BDKRB2 - P30411 |
| 11 | RCVRN - P35243 |
| 12 | CABP1 - Q9NZU7 |
| 13 | GIT1 - Q9Y2X7 |
| 14 | SNCB - Q16143 |
Regulation
Activation:
NA
Inhibition:
NA
Synthesis:
NA
Degradation:
NA
Known Upstream Kinases
For further details on these substrates click on the Substrate Short Name or UniProt ID. Phosphosite Location is hyperlinked to PhosphoNET
predictions.
Based on in vitro and/or in vivo phosphorylation data
| Kinase Short Name | UniProt ID (Human) | Phosphosite Location | Phosphosite Sequence | Effect of Phosphorylation |
|---|
Known Downstream Substrates
For further details on these substrates click on the Substrate Short Name or UniProt ID. Phosphosite Location is hyperlinked to PhosphoNET
predictions.
Based on in vitro and/or in vivo phosphorylation data
| Substrate Short Name | UniProt ID (Human) | Phosphosite Location | Phosphosite Sequence | Effect of Phosphorylation |
|---|
| ADRB2 | P07550 | S355 | KAYGNGYSSNGNTGE | |
| ADRB2 | P07550 | S356 | AYGNGYSSNGNTGEQ | |
| ADRB2 | P07550 | S396 | GHQGTVPSDNIDSQG | |
| ADRB2 | P07550 | S401 | VPSDNIDSQGRNCST | |
| ADRB2 | P07550 | S407 | DSQGRNCSTNDSLL_ | |
| ADRB2 | P07550 | S411 | RNCSTNDSLL_____ | |
| ADRB2 | P07550 | T384 | LCEDLPGTEDFVGHQ | |
| ADRB2 | P07550 | T393 | DFVGHQGTVPSDNID | |
| GPRK5 (GRK5) | P34947 | S484 | VLDIEQFSTVKGVNL | |
| GPRK5 (GRK5) | P34947 | T485 | LDIEQFSTVKGVNLD | |
| p53 (TP53) | P04637 | T55 | DDIEQWFTEDPGPDE | + |
| SNCA | P37840 | S129 | NEAYEMPSEEGYQDY |
Protein Kinase Specificity
Matrix of observed frequency (%) of amino acids in aligned protein substrate phosphosites
Matrix Type:
Predicted from the application of the Kinexus Kinase Substrate Predictor Version 2.0 algorithm, which was trained with over 10,000 kinase-protein substrate pairs and 8,000 kinase-peptide substrate pairs.
Domain #:
1
Inhibitors
For further details on these inhibitors click on the Compound Name and enter it into DrugKiNET or click on the ID's
Based on in vitro and/or in vivo phosphorylation data
| Compound Name | KD, Ki or IC50 (nM) | PubChem ID | ChEMBL ID | PubMed ID |
|---|
| Staurosporine | IC50 > 150 nM | 5279 | 22037377 | |
| Ophiocordin | IC50 = 160 nM | 5287736 | 60254 | 20128603 |
| A 443654 | IC50 = 1 µM | 10172943 | 379300 | 19465931 |
| K-252a; Nocardiopsis sp. | IC50 > 1 µM | 3813 | 281948 | 22037377 |
| MK5108 | IC50 > 1 µM | 24748204 | 20053775 | |
| Ro-32-0432 | IC50 > 1 µM | 127757 | 26501 | 22037377 |
| AZ960 | IC50 < 2 µM | 25099184 | 18775810 |
Disease Linkage
General Disease Association:
Cancer
Comments:
A L41Q mutation in African Americans has been associated with better outcome, and reduced mortality in heart failure or cardiac disease.
Specific Cancer Types:
Prostate cancer
Gene Expression in Cancers:
TranscriptoNET (www.transcriptonet.ca) analysis with mRNA expression data retrieved from the National Center for Biotechnology Information's Gene Expression Omnibus (GEO) database, which was normalized against 60 abundantly and commonly found proteins, indicated altered expression for this protein kinase as shown here as the percent change from normal tissue controls (%CFC) as supported with the Student T-test in the following types of human cancers: Barrett's esophagus epithelial metaplasia (%CFC= +144, p<0.018); Brain glioblastomas (%CFC= +593, p<0.004); Brain oligodendrogliomas (%CFC= +1480, p<0.028); Clear cell renal cell carcinomas (cRCC) (%CFC= +103, p<0.002); Colorectal adenocarcinomas (early onset) (%CFC= +72, p<0.05); Lung adenocarcinomas (%CFC= -76, p<0.0001); and Skin melanomas - malignant (%CFC= -60, p<0.003). The COSMIC website notes an up-regulated expression score for GRK5 in diverse human cancers of 273, which is 0.6-fold of the average score of 462 for the human protein kinases. The down-regulated expression score of 11 for this protein kinase in human cancers was 0.2-fold of the average score of 60 for the human protein kinases.
Mutagenesis Experiments:
Insertional mutagenesis studies in mice have not yet revealed a role for this protein kinase in mouse cancer oncogenesis. Phosphorylation of p53 can be inhibited with a K215R mutation. GRK5 was excluded from the nucleus only with the following mutations, in conjunction, R388A + K389A + K391A + K393A + R394A. GRK5 phosphotransferase activity can be decreased by ~15 fold with the S484A and T485A mutations. Localization to the plasma membrane can be impaired with L550A, L551A, L554A, and F555A mutations.
Mutation Rate in All Cancers:
Percent mutation rates per 100 amino acids length in human cancers: 0.07 % in 25134 diverse cancer specimens. This rate is only -6 % lower and is very similar to the average rate of 0.075 % calculated for human protein kinases in general.
Mutation Rate in Specific Cancers:
Highest percent mutation rates per 100 amino acids length in human cancers: 0.39 % in 1270 large intestine cancers tested; 0.27 % in 864 skin cancers tested; 0.25 % in 603 endometrium cancers tested; 0.2 % in 589 stomach cancers tested; 0.16 % in 1822 lung cancers tested; 0.15 % in 548 urinary tract cancers tested; 0.09 % in 966 upper aerodigestive tract cancers tested; 0.05 % in 1459 pancreas cancers tested; 0.01 % in 1512 liver cancers tested.
Frequency of Mutated Sites:
None > 4 in 20,409 cancer specimens
Comments:
Only 1 deletion, 1 insertion and no complex mutations are noted on the COSMIC website.