
Nomenclature
Short Name:
TGFbR1
Full Name:
TGF-beta receptor type I
Alias:
- AAT5
- Activin receptor-like kinase 5
- ESK2
- LDS1A
- LSD2A
- SKR4; TGF-beta receptor type I; TGF-beta type I receptor; TGFR1
- ACVRLK4
- ADRB2
- ALK5
- EC 2.7.11.30
Classification
Type:
Protein-serine/threonine kinase
Group:
TKL
Family:
STKR
SubFamily:
Type1

Specific Links
Structure
Mol. Mass (Da):
55,960
# Amino Acids:
503
# mRNA Isoforms:
3
mRNA Isoforms:
56,348 Da (507 AA; P36897-2); 55,960 Da (503 AA; P36897); 47,690 Da (426 AA; P36897-3)
4D Structure:
Interacts with CD109 and RBPMS. The unphosphorylated protein interacts with FKBP1A and is stabilized the inactive conformation. Phosphorylation of the GS region abrogates FKBP1A binding. Interacts with SMAD2 when phosphorylated on several residues in the
1D Structure:
3D Image (rendered using PV Viewer):
PDB ID
Subfamily Alignment
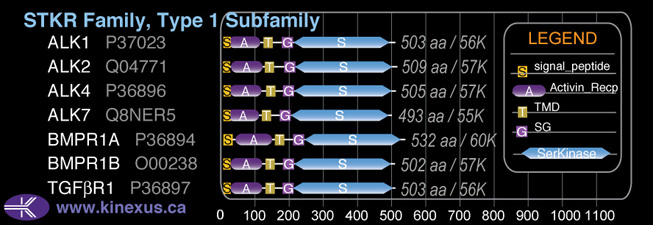
Domain Distribution:
| Start | End | Domain |
|---|---|---|
| 1 | 26 | signal_peptide |
| 21 | 114 | Activin_recp |
| 126 | 148 | TMD |
| 175 | 204 | GS |
| 205 | 495 | Pkinase |
Post-translation Modifications
For detailed information on phosphorylation of this kinase go to PhosphoNET
N-GlcNAcylated:
N45.
Other:
Glycyl lysine isopeptide (Lys-Gly) (interchain with G-Cter in SUMO) predicted to be linked to K391.
Serine phosphorylated:
S165, S172, S187, S189, S191, S210.
Threonine phosphorylated:
T176, T185, T186, T200+, T204+, T298.
Ubiquitinated:
K178, K391, K502.
Distribution
Based on gene microarray analysis from the NCBI
Human Tissue Distribution
% Max Expression:
Mean Expression:
Number of Samples:
Standard Deviation:
% Max Expression:
Mean Expression:
Number of Samples:
Standard Deviation:
 56
56
1558
28
1681
 1.1
1.1
30
14
29
 23
23
655
8
326
 16
16
445
124
1070
 33
33
916
34
748
 2
2
47
55
67
 7
7
208
43
365
 46
46
1291
47
2781
 7
7
206
10
201
 9
9
239
124
309
 5
5
147
35
224
 18
18
513
146
624
 9
9
266
19
354
 1
1
27
12
19
 4
4
113
32
127
 2
2
65
19
85
 8
8
220
455
1315
 100
100
2803
15
9925
 4
4
108
92
142
 24
24
683
112
628
 10
10
274
31
361
 9
9
250
33
334
 11
11
301
17
388
 15
15
424
17
661
 8
8
224
31
269
 34
34
956
76
1177
 7
7
197
22
292
 65
65
1819
16
6401
 17
17
465
17
605
 4
4
123
42
147
 25
25
701
18
459
 58
58
1631
31
2858
 4
4
125
106
416
 37
37
1048
83
828
 8
8
211
48
240
Evolution
Species Conservation
PhosphoNET % Identity:
PhosphoNET % Similarity:
Homologene %
Identity:
PhosphoNET % Identity:
PhosphoNET % Similarity:
Homologene %
Identity:
 100
100
100
100 99.8
99.8
99.8
100 99.6
99.6
99.6
100 -
-
-
96 -
-
-
97 87.4
87.4
88.7
99 -
-
-
- 96.4
96.4
97
97 96
96
96.6
97 -
-
-
- 89.9
89.9
91.5
- 53.5
53.5
68.2
94 30.9
30.9
47.4
88 79.6
79.6
85.5
85 -
-
-
- -
-
-
60 -
-
-
- 29.1
29.1
43.5
42 -
-
-
- -
-
-
- -
-
-
- -
-
-
- -
-
-
- -
-
-
- -
-
-
-
For a wider analysis go to PhosphoNET Evolution in PhosphoNET
Binding Proteins
Examples of known interacting proteins
hiddentext
| No. | Name – UniProt ID |
|---|---|
| 1 | SMAD7 - O15105 |
| 2 | TGFB3 - P10600 |
| 3 | SMAD2 - Q15796 |
| 4 | TGFB1 - P01137 |
| 5 | STRAP - Q9Y3F4 |
| 6 | SMURF2 - Q9HAU4 |
| 7 | TTC5 - Q8N0Z6 |
| 8 | BMPR1B - O00238 |
| 9 | SMAD1 - Q15797 |
| 10 | SMAD6 - O43541 |
| 11 | TRAP1 - Q12931 |
| 12 | CD44 - P16070 |
| 13 | AP2B1 - P63010 |
| 14 | FNTA - P49354 |
| 15 | DOCK5 - Q9H7D0 |
Regulation
Activation:
Activated by binding transforming growth factor-beta (TGFb), which appears to induce heterodimerization and autophosphorylation. Phosphorylation of Thr-200 and Thr-204 increases phosphotransferase acivity.
Protein Info
Short Name:
TGFBR1
Full Name:
Transforming growth factor-beta
Inhibition:
NA
Synthesis:
NA
Degradation:
NA
Known Upstream Kinases
For further details on these substrates click on the Substrate Short Name or UniProt ID. Phosphosite Location is hyperlinked to PhosphoNET
predictions.
Based on in vitro and/or in vivo phosphorylation data
| Kinase Short Name | UniProt ID (Human) | Phosphosite Location | Phosphosite Sequence | Effect of Phosphorylation |
|---|
Known Downstream Substrates
For further details on these substrates click on the Substrate Short Name or UniProt ID. Phosphosite Location is hyperlinked to PhosphoNET
predictions.
Based on in vitro and/or in vivo phosphorylation data
| Substrate Short Name | UniProt ID (Human) | Phosphosite Location | Phosphosite Sequence | Effect of Phosphorylation |
|---|
Protein Kinase Specificity
Matrix of observed frequency (%) of amino acids in aligned protein substrate phosphosites
Matrix Type:
Predicted from the application of the Kinexus Kinase Substrate Predictor Version 2.0 algorithm, which was trained with over 10,000 kinase-protein substrate pairs and 8,000 kinase-peptide substrate pairs.
Domain #:
1
Inhibitors
For further details on these inhibitors click on the Compound Name and enter it into DrugKiNET or click on the ID's
Based on in vitro and/or in vivo phosphorylation data
| Compound Name | KD, Ki or IC50 (nM) | PubChem ID | ChEMBL ID | PubMed ID |
|---|
Disease Linkage
General Disease Association:
Cancer, cardiovascular, eye, and bone disorders
Specific Diseases (Non-cancerous):
Loeys-Dietz syndrome, Type 1 (LDS1); Multiple self-healing squamous epithelioma (MSSE), susceptiblity to; Aortic aneurysm; Aneurysm; Loeys-Dietz syndrome; Marfan syndrome; Thoracic aortic Aneurysm; Thoracic aortic aneurysms and aortic dissections; Kabuki syndrome; Camurati-Engelmann disease; Transient hypogammaglobulinemia; Transient hypogammaglobulinemia of Infancy; Aortic aneurysm, Familial thoracic 4; TGFBR1-related thoracic aortic aneurysms and aortic dissections; TGFBR1-related Loeys-Dietz syndrome
Comments:
TGFBR2 defects have been associated with Loeys-Dietz Syndrome 1, which is a connective tissue disease characterized by the occurrence of aortic aneurysms, widely spaced eyes (hypertelorism), cleft palate, split uvula, and arterial tuberosity, among others. C41Y, N45S, G52R and P83L are associated with multiple self-healing squamous epithelioma, which is a disorder characterized by multiple skin tumours that undergo spontaneous regression. There is also a possible association between variation in the gene and susceptibility to abdominal aortic aneurysm.
Specific Cancer Types:
Colorectal cancer (CRC); Breast cancer
Comments:
TGFbR1 may be a tumour suppressor protein (TSP). Haploinsufficiency of TGFbR1 was found to associate with early onset adenocarcinoma and increased tumour cell proliferation.
Gene Expression in Cancers:
TranscriptoNET (www.transcriptonet.ca) analysis with mRNA expression data retrieved from the National Center for Biotechnology Information's Gene Expression Omnibus (GEO) database, which was normalized against 60 abundantly and commonly found proteins, indicated altered expression for this protein kinase as shown here as the percent change from normal tissue controls (%CFC) as supported with the Student T-test in the following types of human cancers: Bladder carcinomas (%CFC= -54, p<(0.0003); Brain glioblastomas (%CFC= -88, p<0.012); Brain oligodendrogliomas (%CFC= -79, p<0.025); Clear cell renal cell carcinomas (cRCC) stage I (%CFC= +2438, p<0.005); Papillary thyroid carcinomas (PTC) (%CFC= +119, p<0.081); and Prostate cancer - metastatic (%CFC= -65, p<0.0001). The COSMIC website notes an up-regulated expression score for TGFbR1 in diverse human cancers of 358, which is 0.8-fold of the average score of 462 for the human protein kinases. The down-regulated expression score of 9 for this protein kinase in human cancers was 0.2-fold of the average score of 60 for the human protein kinases.
Mutagenesis Experiments:
Insertional mutagenesis studies in mice support a role for this protein kinase in mouse cancer oncogenesis.
Mutation Rate in All Cancers:
Percent mutation rates per 100 amino acids length in human cancers: 0.11 % in 25431 diverse cancer specimens. This rate is a modest 1.4-fold higher than the average rate of 0.075 % calculated for human protein kinases in general.
Mutation Rate in Specific Cancers:
Highest percent mutation rates per 100 amino acids length in human cancers: 1.99 % in 10 peritoneum cancers tested; 0.49 % in 1329 large intestine cancers tested; 0.3 % in 603 endometrium cancers tested; 0.25 % in 864 skin cancers tested; 0.24 % in 589 stomach cancers tested; 0.18 % in 548 urinary tract cancers tested; 0.16 % in 1957 lung cancers tested; 0.16 % in 127 biliary tract cancers tested; 0.12 % in 1512 liver cancers tested; 0.08 % in 2082 central nervous system cancers tested; 0.07 % in 273 cervix cancers tested; 0.06 % in 939 prostate cancers tested; 0.05 % in 441 autonomic ganglia cancers tested; 0.05 % in 1490 breast cancers tested.
Frequency of Mutated Sites:
Most frequent mutations with the number of reports indicated in brackets: N45S (6); S241L (6).
Comments:
Only 5 deletions, 4 insertions and no complex mutations are noted on the COSMIC website.