
Nomenclature
Short Name:
ARG
Full Name:
Abelson murine leukemia viral oncogene homologue 2
Alias:
- Abelson-related gene
- Tyrosine kinase ARG
- V-abl Abelson murine leukemia viral oncogene 2
- V-abl Abelson murine leukemia viral oncogene homolog 2
- ABLL
- ARG
- EC 2.7.10.2
- Kinase Arg
- ABL2
Classification
Type:
Protein-tyrosine kinase
Group:
TK
Family:
Abl
SubFamily:
NA

Specific Links
Structure
Mol. Mass (Da):
128,343
# Amino Acids:
1182
# mRNA Isoforms:
9
mRNA Isoforms:
128,343 Da (1182 AA; P42684); 126,684 Da (1167 AA; P42684-3); 126,219 Da (1161 AA; P42684-6); 124,560 Da (1146 AA; P42684-2); 117,942 Da (1079 AA; P42684-5); 116,283 Da (1064 AA; P42684-10); 115,817 Da (1058 AA; P42684-7); 114,159 Da (1043 AA; P42684-4); 60,864 Da (542 AA; P42684-8)
4D Structure:
Interacts with PSMA7.
1D Structure:
3D Image (rendered using PV Viewer):
PDB ID
Subfamily Alignment
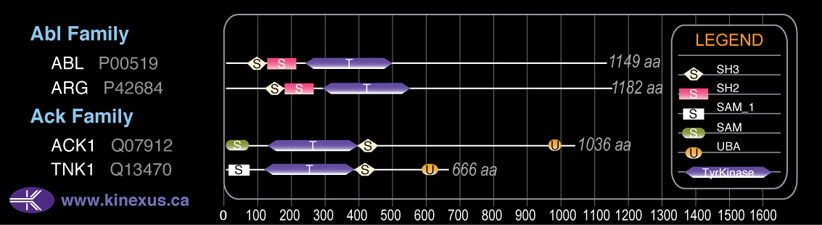
Domain Distribution:
Kinexus Products
Click on entries below for direct links to relevant products from Kinexus for this protein kinase.
hiddentext
Post-translation Modifications
For detailed information on phosphorylation of this kinase go to PhosphoNET
Acetylated:
K320, K659, K776 (N6) (predicted), K981.
Methylated:
K667.
Myristoylated:
G2.
Serine phosphorylated:
S31, S71, S72, S96, S97, S121, S159, S194, S203, S208, S275, S311, S577, S602, S618, S620, S631, S633, S634, S655, S671, S781, S783, S817, S819, S820, S866, S915, S936, S969, S1051, S1054, S1107.
Threonine phosphorylated:
T68, T163, T313, T435, T438+, T440+, T452, T581, T664, T753, T784, T815, T818, T864, T938, T1112.
Tyrosine phosphorylated:
Y116, Y139, Y161, Y174, Y213, Y218, Y231, Y261+, Y272, Y299-, Y303-, Y310-, Y439+, Y459, Y515, Y568, Y683, Y718.
Ubiquitinated:
K331.
Distribution
Based on gene microarray analysis from the NCBI
Human Tissue Distribution
% Max Expression:
Mean Expression:
Number of Samples:
Standard Deviation:
% Max Expression:
Mean Expression:
Number of Samples:
Standard Deviation:
 93
93
1442
28
1302
 5
5
73
10
77
 4
4
68
22
38
 16
16
255
120
445
 46
46
723
34
626
 3
3
41
55
29
 9
9
135
39
326
 100
100
1556
48
3973
 11
11
175
10
152
 6
6
91
117
69
 2
2
38
39
34
 34
34
524
131
615
 4
4
59
33
26
 3
3
52
6
49
 4
4
57
36
47
 4
4
57
17
33
 6
6
88
343
889
 4
4
70
27
41
 5
5
81
100
78
 39
39
601
112
546
 4
4
62
35
70
 3
3
47
37
46
 4
4
59
31
36
 5
5
75
27
70
 4
4
68
35
70
 68
68
1056
83
2266
 3
3
44
36
39
 3
3
46
28
35
 3
3
49
27
39
 10
10
158
42
97
 36
36
567
30
301
 92
92
1431
31
2826
 12
12
183
103
467
 57
57
880
83
756
 10
10
155
66
163
Evolution
Species Conservation
PhosphoNET % Identity:
PhosphoNET % Similarity:
Homologene %
Identity:
PhosphoNET % Identity:
PhosphoNET % Similarity:
Homologene %
Identity:
 100
100
100
100 99.8
99.8
99.8
100 96.4
96.4
97.7
96 -
-
-
- -
-
-
- 94.3
94.3
94.9
98 -
-
-
- 94.7
94.7
96
95 89.3
89.3
90.7
93 -
-
-
- 84.4
84.4
88.2
- 83.7
83.7
87.6
88.5 70.8
70.8
79.1
78 68
68
76.1
75 -
-
-
- 34.8
34.8
46.4
- -
-
-
- 32.2
32.2
48.5
- -
-
-
- -
-
-
- -
-
-
- -
-
-
- -
-
-
- -
-
-
- -
-
-
-
For a wider analysis go to PhosphoNET Evolution in PhosphoNET
Binding Proteins
Examples of known interacting proteins
hiddentext
| No. | Name – UniProt ID |
|---|---|
| 1 | CRK - P46108 |
| 2 | RIN1 - Q13671 |
| 3 | CAT - P04040 |
| 4 | HCK - P08631 |
| 5 | ABI2 - Q9NYB9 |
| 6 | BCR - P11274 |
| 7 | ERBB3 - P21860 |
| 8 | ERBB2 - P04626 |
| 9 | EGFR - P00533 |
| 10 | PIK3R1 - P27986 |
| 11 | NCK1 - P16333 |
Regulation
Activation:
Phosphorylation of Tyr-261 reduces ubiquitination and protein degradation. Activated by autophosphorylation as well as by Src-family kinase-mediated phosphorylation. Activated by RIN1 binding to the SH2 and SH3 domains.
Inhibition:
NA
Synthesis:
NA
Degradation:
NA
Known Upstream Kinases
For further details on these substrates click on the Substrate Short Name or UniProt ID. Phosphosite Location is hyperlinked to PhosphoNET
predictions.
Based on in vitro and/or in vivo phosphorylation data
| Kinase Short Name | UniProt ID (Human) | Phosphosite Location | Phosphosite Sequence | Effect of Phosphorylation |
|---|
Known Downstream Substrates
For further details on these substrates click on the Substrate Short Name or UniProt ID. Phosphosite Location is hyperlinked to PhosphoNET
predictions.
Based on in vitro and/or in vivo phosphorylation data
| Substrate Short Name | UniProt ID (Human) | Phosphosite Location | Phosphosite Sequence | Effect of Phosphorylation |
|---|
| Arg (Abl2) | P42684 | Y261 | GLVTTLHYPAPKCNK | + |
| Arg (Abl2) | P42684 | Y439 | RLMTGDTYTAHAGAK | + |
| Catalase | P04040 | Y230 | NANGEAVYCKFHYKT | - |
| Catalase | P04040 | Y385 | YRARVANYQRDGPMC | - |
| Crk | P46108 | Y221 | GGPEPGPYAQPSVNT | + |
| GPX1 | P07203 | Y96 | EILNSLKYVRPGGGF | |
| IkBb | Q9JIA3 | Y161 | PRDASDTYLTQSQDH | + |
| PDGFRB | P09619 | Y686 | IITEYCRYGDLVDYL | + |
| PSMA7 | O14818 | Y153 | QTDPSGTYHAWKANA | |
| PTPN11 (SHP2) | Q06124 | Y279 | ENKNKNRYKNILPFD | |
| PTPN11 (SHP2) | Q06124 | Y584 | REDSARVYENVGLMQ | + |
| PTPN11 (SHP2) | Q06124 | Y63 | IQNTGDYYDLYGGEK | |
| Rin1 | Q13671 | Y36 | KPAQDPLYDVPNASG | |
| Siva | O15304 | Y34 | RGVCAERYSQEVFEK |
Protein Kinase Specificity
Matrix of observed frequency (%) of amino acids in aligned protein substrate phosphosites
Matrix Type:
Experimentally derived from alignment of 35 known protein substrate phosphosites and 52 peptides phosphorylated by recombinant Arg in vitro tested in-house by Kinexus.
Domain #:
1
Inhibitors
For further details on these inhibitors click on the Compound Name and enter it into DrugKiNET or click on the ID's
Based on in vitro and/or in vivo phosphorylation data
| Compound Name | KD, Ki or IC50 (nM) | PubChem ID | ChEMBL ID | PubMed ID |
|---|
Disease Linkage
General Disease Association:
Cancer
Specific Cancer Types:
Leukemias; Leukemias, acute myeloid, with eosinophilia
Comments:
ARG may be a tumour suppressor protein (TSP) in its normal form. The active form of the protein kinase normally acts to inhibit tumour cell proliferation. ARG gene expression is found in both normal and tumour cells, it is often found as a fusion gene with ETV6 in acute non lymphocytic leukemias. However, the broad distribution of point mutations seen in various cancers, including about a third within the kinase catalytic domain, indicate that these mutations are likely to be silent or result in loss of function. ARG has also been reported to promote breast tumour cell invasion and dissemination, but attenuates the growth of breast tumours. This indicates that wild-type ARG may as a tumour suppressor protein.
Gene Expression in Cancers:
TranscriptoNET (www.transcriptonet.ca) analysis with mRNA expression data retrieved from the National Center for Biotechnology Information's Gene Expression Omnibus (GEO) database, which was normalized against 60 abundantly and commonly found proteins, indicated altered expression for this protein kinase as shown here as the percent change from normal tissue controls (%CFC) as supported with the Student T-test in the following types of human cancers: Brain oligodendrogliomas (%CFC= -87, p<0.064); Breast epithelial carcinomas (%CFC= +46, p<0.093); Clear cell renal cell carcinomas (cRCC) (%CFC= +67, p<0.003); Clear cell renal cell carcinomas (cRCC) stage I (%CFC= +238, p<0.007); Malignant pleural mesotheliomas (MPM) tumours (%CFC= +58, p<0.021); Pituitary adenomas (ACTH-secreting) (%CFC= -45); Uterine leiomyomas (%CFC= +314, p<0.017); and Uterine leiomyosarcomas (%CFC= +121, p<0.024). The COSMIC website notes an up-regulated expression score for ARG in diverse human cancers of 668, which is 1.5-fold of the average score of 462 for the human protein kinases. The down-regulated expression score of 31 for this protein kinase in human cancers was 0.5-fold of the average score of 60 for the human protein kinases.
Mutagenesis Experiments:
Insertional mutagenesis studies in mice have not yet revealed a role for this protein kinase in mouse cancer oncogenesis.
Mutation Rate in All Cancers:
Percent mutation rates per 100 amino acids length in human cancers: 0.07 % in 25829 diverse cancer specimens. This rate is only -8 % lower and is very similar to the average rate of 0.075 % calculated for human protein kinases in general.
Mutation Rate in Specific Cancers:
Highest percent mutation rates per 100 amino acids length in human cancers: 0.34 % in 1176 large intestine cancers tested; 0.28 % in 602 endometrium cancers tested; 0.2 % in 805 skin cancers tested; 0.17 % in 1944 lung cancers tested; 0.14 % in 589 stomach cancers tested; 0.06 % in 1565 breast cancers tested.
Frequency of Mutated Sites:
None > 6 in 20,913 cancer specimens
Comments:
Twelve deletion, 2 insertions and 1 complex mutations are noted on the COSMIC website.