
Nomenclature
Short Name:
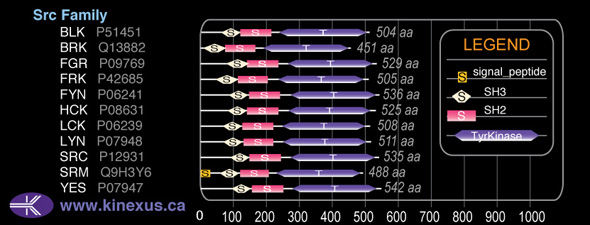
FRK
Full Name:
Fyn-related kinase
Alias:
- EC 2.7.1.112
- EC 2.7.10.2
- GTK
- Nuclear tyrosine protein kinase RAK
- PTK5
- RAK
Classification
Type:
Protein-tyrosine kinase
Group:
TK
Family:
Src
SubFamily:
NA

Specific Links
Structure
Mol. Mass (Da):
58,254
# Amino Acids:
505
# mRNA Isoforms:
2
mRNA Isoforms:
58,254 Da (505 AA; P42685); 41,980 Da (363 AA; P42685-2)
4D Structure:
Interacts (via the SH3-domain) with PTEN.
1D Structure:
Subfamily Alignment
Domain Distribution:
Kinexus Products
Click on entries below for direct links to relevant products from Kinexus for this protein kinase.
hiddentext
Post-translation Modifications
For detailed information on phosphorylation of this kinase go to PhosphoNET
Acetylated:
K409.
Serine phosphorylated:
S37, S40, S62, S92, S93, S102, S133, S139, S145, S147, S184, S389, S407, S495, S496, S498.
Threonine phosphorylated:
T57, T178.
Tyrosine phosphorylated:
Y46, Y53, Y99, Y104, Y132, Y193, Y221, Y303, Y317, Y368, Y387+, Y497.
Distribution
Based on gene microarray analysis from the NCBI
Human Tissue Distribution
% Max Expression:
Mean Expression:
Number of Samples:
Standard Deviation:
% Max Expression:
Mean Expression:
Number of Samples:
Standard Deviation:
 22
22
819
16
1169
 0.2
0.2
7
11
7
 1.3
1.3
49
8
39
 3
3
118
49
250
 7
7
280
14
282
 0.2
0.2
7
37
6
 9
9
360
23
473
 6
6
209
25
322
 9
9
330
10
347
 1.1
1.1
43
63
60
 1.1
1.1
41
22
51
 6
6
244
133
368
 0.2
0.2
8
19
14
 0.1
0.1
4
6
1
 0.7
0.7
28
19
47
 0.2
0.2
7
7
3
 0.2
0.2
6
187
13
 2
2
61
13
72
 0.4
0.4
14
56
18
 6
6
237
56
269
 0.4
0.4
16
17
19
 0.2
0.2
9
19
13
 1.3
1.3
51
17
65
 2
2
86
14
176
 0.4
0.4
14
19
30
 6
6
229
29
307
 0.6
0.6
24
22
30
 1.1
1.1
41
13
49
 0.6
0.6
22
13
23
 1.1
1.1
40
14
48
 7
7
269
18
193
 100
100
3800
21
6291
 7
7
284
48
1144
 11
11
399
31
414
 1.1
1.1
42
22
35
Evolution
Species Conservation
PhosphoNET % Identity:
PhosphoNET % Similarity:
Homologene %
Identity:
PhosphoNET % Identity:
PhosphoNET % Similarity:
Homologene %
Identity:
 100
100
100
100 99.4
99.4
99.8
99 96.6
96.6
98
97 -
-
-
88 -
-
-
- 80.6
80.6
87.7
82 -
-
-
- 88.7
88.7
93
90 88.3
88.3
93.1
90 -
-
-
- -
-
-
- 48.5
48.5
64.7
71 48.4
48.4
64.3
63.5 60.6
60.6
74.1
66 -
-
-
- 56.9
56.9
73.3
64 51.7
51.7
67.1
- 50.5
50.5
69.4
56 56.6
56.6
70.6
- -
-
-
- -
-
-
- -
-
-
- -
-
-
- -
-
-
- -
-
-
-
For a wider analysis go to PhosphoNET Evolution in PhosphoNET
Binding Proteins
Examples of known interacting proteins
hiddentext
| No. | Name – UniProt ID |
|---|---|
| 1 | RB1 - P06400 |
Regulation
Activation:
NA
Inhibition:
NA
Synthesis:
NA
Degradation:
NA
Known Upstream Kinases
For further details on these substrates click on the Substrate Short Name or UniProt ID. Phosphosite Location is hyperlinked to PhosphoNET
predictions.
Based on in vitro and/or in vivo phosphorylation data
| Kinase Short Name | UniProt ID (Human) | Phosphosite Location | Phosphosite Sequence | Effect of Phosphorylation |
|---|
Known Downstream Substrates
For further details on these substrates click on the Substrate Short Name or UniProt ID. Phosphosite Location is hyperlinked to PhosphoNET
predictions.
Based on in vitro and/or in vivo phosphorylation data
| Substrate Short Name | UniProt ID (Human) | Phosphosite Location | Phosphosite Sequence | Effect of Phosphorylation |
|---|
Protein Kinase Specificity
Matrix of observed frequency (%) of amino acids in aligned protein substrate phosphosites
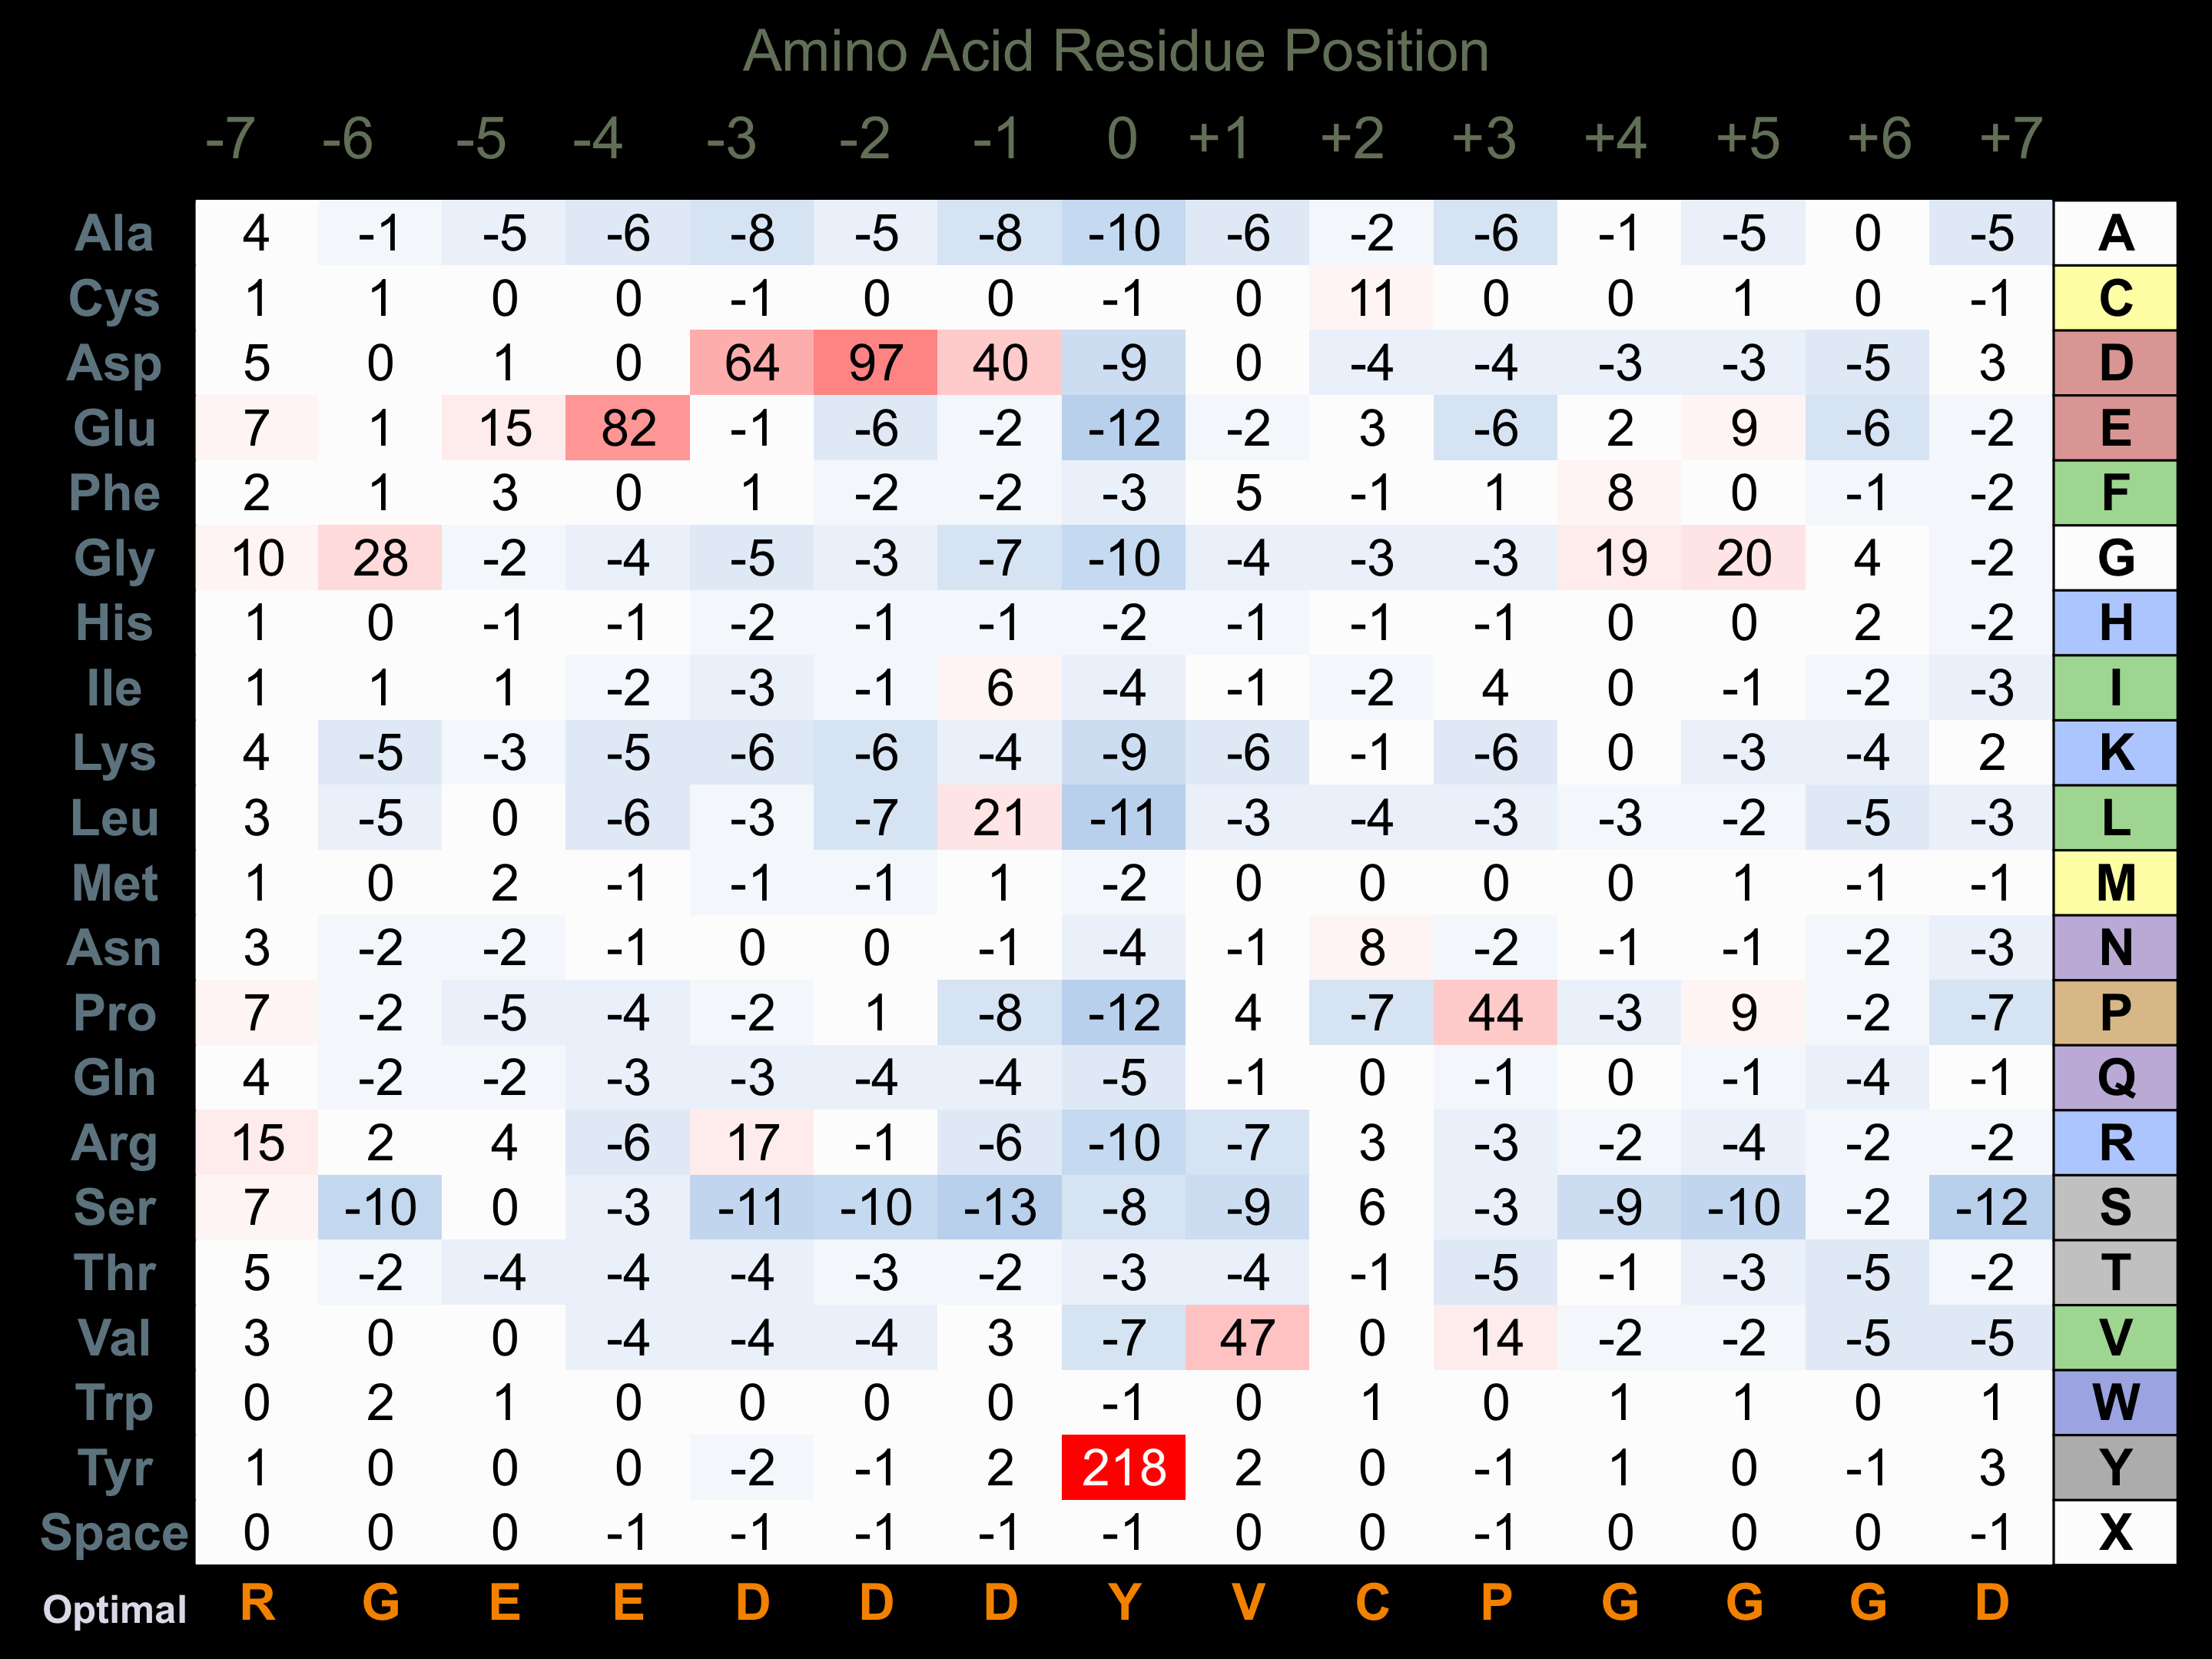
Matrix Type:
Predicted from the application of the Kinexus Kinase Substrate Predictor Version 2.0 algorithm, which was trained with over 10,000 kinase-protein substrate pairs and 8,000 kinase-peptide substrate pairs.
Domain #:
1
Inhibitors
For further details on these inhibitors click on the Compound Name and enter it into DrugKiNET or click on the ID's
Based on in vitro and/or in vivo phosphorylation data
| Compound Name | KD, Ki or IC50 (nM) | PubChem ID | ChEMBL ID | PubMed ID |
|---|
Disease Linkage
Comments:
FRK may be a tumour suppressor protein (TSP). Cancer-related mutations in human tumours point to a loss of function of the protein kinase. The active form of the protein kinase normally acts to inhibit tumour cell proliferation. FRK may operate during G1 and S phase of cell cycle and suppress cell growth.
Gene Expression in Cancers:
The COSMIC website notes an up-regulated expression score for FRK in diverse human cancers of 322, which is 0.7-fold of the average score of 462 for the human protein kinases. The down-regulated expression score of 9 for this protein kinase in human cancers was 0.2-fold of the average score of 60 for the human protein kinases.
Mutagenesis Experiments:
Insertional mutagenesis studies in mice support a role for this protein kinase in mouse cancer oncogenesis. A K262R mutation in FRK abrogates its ability to phosphorylate PTEN.
Mutation Rate in All Cancers:
Percent mutation rates per 100 amino acids length in human cancers: 0.09 % in 25101 diverse cancer specimens. This rate is only 22 % higher than the average rate of 0.075 % calculated for human protein kinases in general.
Mutation Rate in Specific Cancers:
Highest percent mutation rates per 100 amino acids length in human cancers: 0.51 % in 1093 large intestine cancers tested; 0.33 % in 602 endometrium cancers tested; 0.27 % in 805 skin cancers tested; 0.21 % in 1807 lung cancers tested; 0.17 % in 1270 liver cancers tested.
Frequency of Mutated Sites:
None > 7 in 20,385 cancer specimens
Comments:
Only 3 deletions, 1 insertion and 2 complex mutations are noted on the COSMIC website.