• KinATLAS
  • TranscriptoNET
  • PhosphoNET
  • OncoNET
  • KinaseNET
  • DrugKiNET
  • DrugProNET
  • KiNET-AM
  • Kinetica Online

Updated November 2019

Home | Kinexus | Contact | Credits

Nomenclature

Short Name:
EPHB4
Full Name:
Ephrin type-B receptor 4
Alias:
  • EPB4
  • Tyrosine-protein kinase receptor HTK
  • EPH receptor B4
  • HTK
  • Mdk2
  • MYK1
  • Tyro11

Classification

Type:
Protein-tyrosine kinase
Group:
TK
Family:
Eph
SubFamily:
NA


Specific Links

Entrez-Gene Entry: 2050
Entrez-Protein Entry: NP_004435
GeneCards Entry: HTK
KinBASE Entry: EPHB4
OMIM Entry: 600011
Pfam Entry: P54760
PhosphoNET Entry: P54760
Phosphosite Plus Entry: 1922
Protein Data Bank Entry: 2BBA
ScanSite Entry: P54760
Source Entry: EPHB4
UCSD-Nature Entry: A000851
UniProt Entry: P54760
Kinexus Products: EPHB4
Ephrin type-B receptor 4 protein-tyrosine kinase (P593-P599, human) pY596 phosphopeptide - Powder PE-04AMB95

General Links

ClustalW2
GPS-Cuckoo
Human Protein Atlas
Kinase.com
Kinase Research
Kinasource
Kinomer
Netphorest
NetworKIN
Phosida
PhosphoElm
Protein Blast
ScanSite
String

Structure

Mol. Mass (Da):
108,270
# Amino Acids:
987
# mRNA Isoforms:
4
mRNA Isoforms:
108,270 Da (987 AA; P54760); 55,975 Da (516 AA; P54760-2); 45,195 Da (414 AA; P54760-4); 33,342 Da (306 AA; P54760-3)
4D Structure:
NA
1D Structure:
Retrieve Gene Sequence
Retrieve Full Protein Sequence
Retrieve Catalytic Domain Sequence
 
3D Image (rendered using PV Viewer):

PDB ID
2HLE

Subfamily Alignment
subfamily domain
 
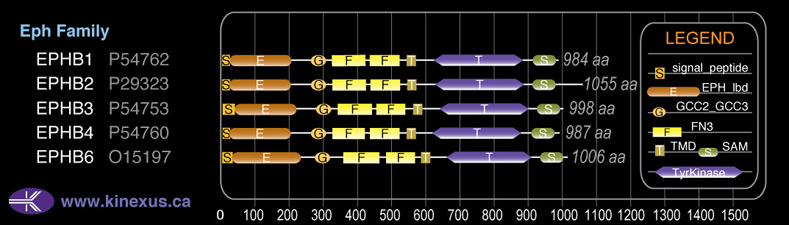
Domain Distribution:
Start End Domain
1 16 signal_peptide
17 197 EPH_lbd
258 302 GCC2_GCC3
323 428 FN3
434 526 FN3
541 563 TMD
615 874 TyrKc
907 971 SAM
615 899 Pkinase
 

Kinexus Products

Click on entries below for direct links to relevant products from Kinexus for this protein kinase.
hiddentext
○ Ephrin type-B receptor 4 protein-tyrosine kinase (P593-P599, human) pY596 phosphopeptide - Powder PE-04AMB95
 

Post-translation Modifications

For detailed information on phosphorylation of this kinase go to PhosphoNET
Acetylated:
K196.
N-GlcNAcylated:
N203, N335, N426.
Serine phosphorylated:

S332, S337, S575, S750, S757, S762, S769, S770, S776, S777, S872, S911, S943, S964.
Threonine phosphorylated:

T321, T322, T544, T587, T595, T713, T773, T775, T953, T976.
Tyrosine phosphorylated:

Y357, Y574, Y581, Y590, Y596, Y614, Y774, Y906, Y924, Y987.
Ubiquitinated:
K973.
 

Distribution

Based on gene microarray analysis from the NCBI
Human Tissue Distribution
% Max Expression:

Mean Expression:

Number of Samples:

Standard Deviation:
% Max Expression:

Mean Expression:

Number of Samples:

Standard Deviation:
  • adipose
    56

    814

    29

    895

  • adrenal
    14

    198

    15

    135

  • bladder
    15

    212

    18

    483

  • brain
    67

    971

    99

    2690

  • breast
    66

    955

    25

    781

  • cervix
    8

    111

    86

    127

  • colon
    16

    236

    31

    490

  • heart
    62

    891

    51

    1434

  • intestine
    30

    441

    17

    342

  • kidney
    10

    145

    73

    109

  • liver
    13

    183

    37

    326

  • lung
    52

    747

    179

    657

  • lymphnode
    10

    139

    40

    405

  • ovary
    9

    131

    12

    108

  • pancreas
    15

    212

    30

    532

  • pituitary
    9

    130

    15

    86

  • prostate
    51

    732

    127

    4397

  • salivarygland
    12

    174

    27

    365

  • skeletalmuscle"
    5

    78

    93

    85

  • skin
    41

    600

    109

    582

  • spinalcord
    8

    115

    29

    260

  • spleen
    22

    323

    33

    680

  • stomach
    17

    245

    28

    395

  • testis
    9

    131

    27

    305

  • thymus
    8

    119

    29

    365

  • thyroid
    100

    1447

    67

    2496

  • tonsil
    7

    105

    43

    269

  • trachea
    12

    180

    27

    370

  • uterus
    27

    390

    27

    860

  • reticulocytes"
    17

    249

    28

    209

  • t-lymphocytes
    35

    508

    24

    489

  • b-lymphocytes
    44

    641

    36

    606

  • neutrophils
    2

    26

    72

    64

  • macrophages
    49

    716

    57

    654

  • sperm
    17

    240

    35

    214


Evolution

Species Conservation
PhosphoNET % Identity:
PhosphoNET % Similarity:
Homologene %
Identity:
PhosphoNET % Identity:
PhosphoNET % Similarity:
Homologene %
Identity:
  • tableheader
    100

    100

    100
  • tableheader
    43.2

    61

    100
  • tableheader
    58.4

    72.1

    99
  • tableheader
    -

    -

    96
  • tableheader
    -

    -

    97
  • tableheader
    95.6

    96.7

    97
  • tableheader
    -

    -

    -
  • tableheader
    92.7

    95.6

    93
  • tableheader
    56.7

    71.8

    93
  • tableheader
    -

    -

    -
  • tableheader
    87.4

    91.5

    -
  • tableheader
    57.6

    72.4

    -
  • tableheader
    56

    72.8

    65
  • tableheader
    50.4

    67.3

    64
  • tableheader
    -

    -

    -
  • tableheader
    -

    -

    -
  • tableheader
    -

    -

    -
  • tableheader
    -

    -

    -
  • tableheader
    -

    -

    -
  • tableheader
    -

    -

    -
  • tableheader
    -

    -

    -
  • tableheader
    -

    -

    -
  • tableheader
    -

    -

    -
  • tableheader
    -

    -

    -
  • tableheader
    -

    -

    -
For a wider analysis go to PhosphoNET Evolution in PhosphoNET
 

Binding Proteins

Examples of known interacting proteins
hiddentext
No. Name – UniProt ID
1 EFNB2 - P52799
2 EGFR - P00533
 

Regulation

Activation:
Activated by binding ephrin-A1, B2, or B3.
Inhibition:
NA
Synthesis:
NA
Degradation:
NA
 

Kinections Map

Click here to download a PPT of the image below
 
Kinections GIF
 

Protein Kinase Specificity

Matrix of observed frequency (%) of amino acids in aligned protein substrate phosphosites

Kinections GIF
Matrix Type:
Predicted from the application of the Kinexus Kinase Substrate Predictor Version 2.0 algorithm, which was trained with over 10,000 kinase-protein substrate pairs and 8,000 kinase-peptide substrate pairs.
Domain #:
1
 

Inhibitors

For further details on these inhibitors click on the Compound Name and enter it into DrugKiNET or click on the ID's
Based on in vitro and/or in vivo phosphorylation data
Compound Name KD, Ki or IC50 (nM) PubChem ID ChEMBL ID PubMed ID
Dasatinib Kd = 340 pM 11153014 1421 18183025
XL647 IC50 = 1.4 nM 10458325 17575237
CHEMBL566515 IC50 = 1.6 nM 44478401 566515 19788238
2hiw EC50 = 4 nM 10062694 18077425
Bosutinib IC50 = 5.5 nM 5328940 288441 19039322
CHEMBL249097 Kd < 10 nM 25138012 249097 19035792
Ponatinib IC50 = 10.2 nM 24826799 20513156
Foretinib Kd = 12 nM 42642645 1230609 22037378
CHEMBL445162 IC50 = 25 nM 25011729 445162 20850301
SureCN4139760 IC50 = 30 nM 25065806
Princeton's TrkA inhibitor compound 20h IC50 < 40 nM
Nilotinib IC50 > 50 nM 644241 255863 22037377
CHEMBL230686 Ki = 63.8 nM 11562302 230686 17113292
CHEMBL436137 IC50 = 64 nM 11719421 436137 16931012
Amgen TBK 1 inhibitor (Compound II) IC50 < 100 nM
AT9283 IC50 > 100 nM 24905142 19143567
HG-9-91-01 IC50 < 100 nM
KIN 112 IC50 < 100 nM
PP2 IC50 < 100 nM 4878 406845
TTT-3002 IC50 = 100 nM
MK5108 IC50 > 150 nM 24748204 20053775
PP121 IC50 = 190 nM 24905142 18849971
Staurosporine IC50 = 233 nM 5279 19397322
BML-275 IC50 > 250 nM 11524144 478629 22037377
Compound 56 IC50 > 250 nM 2857 29197 22037377
PP1 Analog II; 1NM-PP1 IC50 > 250 nM 5154691 573578 22037377
Hesperadin Kd < 400 nM 10142586 514409 19035792
Tivozanib IC50 = 480 nM 9911830 16982756
ZINC00016978 IC50 = 480 nM 5329009 301018 19211246
Alisertib IC50 > 500 nM 24771867 22016509
Cdk1/2 Inhibitor III IC50 = 500 nM 5330812 261720 22037377
Tozasertib IC50 = 500 nM 5494449 572878 22037377
WHI-P154 IC50 = 500 nM 3795 473773 22037377
Vandetanib Kd = 520 nM 3081361 24828 18183025
MLN8054 Kd = 560 nM 11712649 259084 18183025
Crizotinib Kd = 570 nM 11626560 601719 22037378
PP242 IC50 < 600 nM 25243800
Syk Inhibitor IV IC50 < 600 nM 10200390
SureCN3936664 IC50 = 672 nM 11626920 475817 19097792
NVP-TAE684 Kd = 750 nM 16038120 509032 22037378
CHEMBL1650545 IC50 = 770 nM 53316611 1650545 21128646
K00596a IC50 < 800 nM 9549298 200027
Purvalanol A IC50 < 800 nM 456214 23327
Doramapimod IC50 = 900 nM 156422 103667 22014550
GSK-3 Inhibitor IX IC50 > 900 nM 5287844 409450
GSK650394A IC50 > 900 nM 25022668 558642
AG1478 IC50 > 1 µM 2051 7917 22037377
Aloisine A IC50 > 1 µM 5326843 75680 22037377
Baricitinib IC50 > 1 µM 44205240 20363976
BMS-690514 Kd = 1 µM 11349170 21531814
Cabozantinib IC50 < 1 µM 25102847 21926191
Gefitinib IC50 = 1 µM 123631 939 18849971
Icotinib IC50 > 1 µM 22024915 22112293
IKK-2 Inhibitor IV IC50 > 1 µM 9903786 257167 22037377
Purvalanol B IC50 = 1 µM 448991 23254
R406 IC50 = 1 µM 11984591
Ruxolitinib IC50 = 1 µM 25126798 1789941
Silmitasertib IC50 > 1 µM 24748573 21174434
SNS314 IC50 > 1 µM 16047143 514582 18678489
SureCN10063060 Ki > 1 µM 52936621 21391610
Syk Inhibitor IC50 = 1 µM 6419747 104279
VX745 Kd = 1 µM 3038525 119385 15711537
WZ3146 Kd > 1 µM 44607360 20033049
WZ4002 Kd > 1 µM 44607530 20033049
Cediranib Kd = 1.1 µM 9933475 491473 22037378
Nintedanib Kd = 1.1 µM 9809715 502835 22037378
Pelitinib Kd = 1.3 µM 6445562 607707 15711537
Linifanib Kd = 1.4 µM 11485656 223360 18183025
Pyrrolo-pyrimidone; 17 IC50 = 1.4 µM 16119021 461140 18945615
Canertinib Kd = 1.8 µM 156414 31965 18183025
Sorafenib Kd = 1.8 µM 216239 1336 18183025
TG101348 Kd = 2.1 µM 16722836 1287853 22037378
Erlotinib Kd = 2.2 µM 176870 553 22037378
Sunitinib Kd = 2.2 µM 5329102 535 15711537
CHEMBL489083 IC50 = 2.3 µM 25178539 489083 19053831
SureCN5632345 Kd < 2.5 µM 44593646 515466 19035792
KW2449 Kd = 2.9 µM 11427553 1908397 22037378
SureCN4875304 IC50 > 3.5 µM 46871765 20472445
JNJ-28871063 IC50 > 4 µM 17747413 17975007
SureCN2579964 IC50 < 4 µM 290221 233000 22934575
Syk Inhibitor II IC50 > 4.5 µM 16760670
 

Disease Linkage

General Disease Association:

Cancer
Specific Cancer Types:
Prostate cancer
Gene Expression in Cancers:

TranscriptoNET (www.transcriptonet.ca) analysis with mRNA expression data retrieved from the National Center for Biotechnology Information's Gene Expression Omnibus (GEO) database, which was normalized against 60 abundantly and commonly found proteins, indicated altered expression for this protein kinase as shown here as the percent change from normal tissue controls (%CFC) as supported with the Student T-test in the following types of human cancers: Barrett's esophagus epithelial metaplasia (%CFC= +86, p<0.033); Brain glioblastomas (%CFC= -50, p<0.018); Breast epithelial carcinomas (%CFC= -52, p<0.014); Colon mucosal cell adenomas (%CFC= +91, p<0.0001); Ovary adenocarcinomas (%CFC= +129, p<0.011); and Uterine fibroids (%CFC= +51, p<0.053). The COSMIC website notes an up-regulated expression score for EPHB4 in diverse human cancers of 667, which is 1.4-fold of the average score of 462 for the human protein kinases. The down-regulated expression score of 22 for this protein kinase in human cancers was 0.4-fold of the average score of 60 for the human protein kinases.
Mutagenesis Experiments:

Insertional mutagenesis studies in mice support a role for this protein kinase in mouse cancer oncogenesis. EFNB2 binding to EphB4 can be inhibited with a L95R mutation.
Mutation Rate in All Cancers:

Percent mutation rates per 100 amino acids length in human cancers: 0.08 % in 25618 diverse cancer specimens. This rate is very similar (+ 10% higher) to the average rate of 0.075 % calculated for human protein kinases in general.
Mutation Rate in Specific Cancers:

Highest percent mutation rates per 100 amino acids length in human cancers: 0.35 % in 895 skin cancers tested; 0.34 % in 1270 large intestine cancers tested; 0.31 % in 629 stomach cancers tested; 0.19 % in 273 cervix cancers tested; 0.17 % in 603 endometrium cancers tested; 0.16 % in 710 oesophagus cancers tested; 0.16 % in 1956 lung cancers tested; 0.11 % in 548 urinary tract cancers tested; 0.09 % in 1512 liver cancers tested; 0.07 % in 1276 kidney cancers tested.
Frequency of Mutated Sites:

None > 4 in 20,716 cancer specimens
Comments:
Only 2 deletions, 1 insertion, and no complex mutations are noted on the COSMIC website.
 
COSMIC Entry:
EPHB4
OMIM Entry:
600011
  • Home
  • Top of Page
Copyright 2019 Kinexus BioInformatics Corporation