
Nomenclature
Short Name:
PKN2
Full Name:
Protein kinase N2
Alias:
- Cardiolipin-activated protein kinase Pak2
- PRO2042
- PRK2
- PRKCL2
- Protease-activated kinase 2
- Protein kinase C-like 2; Protein kinase N2; Protein-kinase C-related kinase 2
- EC 2.7.11.13
- MGC71074
- MGC150606
- PAK-2
Classification
Type:
Protein-serine/threonine kinase
Group:
AGC
Family:
PKN
SubFamily:
NA

Specific Links
Structure
Mol. Mass (Da):
112035
# Amino Acids:
984
# mRNA Isoforms:
5
mRNA Isoforms:
112,035 Da (984 AA; Q16513); 110,345 Da (968 AA; Q16513-2); 106,217 Da (936 AA; Q16513-3); 94,136 Da (827 AA; Q16513-4); 75,171 Da (658 AA; Q16513-5)
4D Structure:
NA
1D Structure:
3D Image (rendered using PV Viewer):
PDB ID
Subfamily Alignment
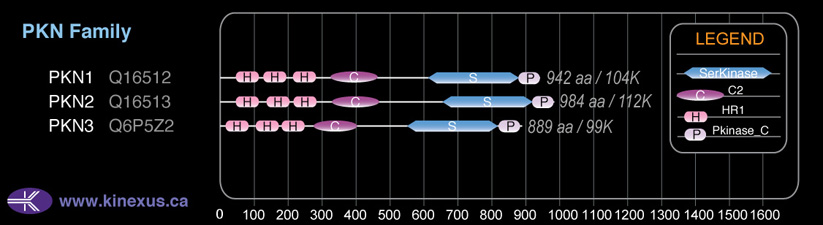
Domain Distribution:
Kinexus Products
Click on entries below for direct links to relevant products from Kinexus for this protein kinase.
hiddentext
Post-translation Modifications
For detailed information on phosphorylation of this kinase go to PhosphoNET
Acetylated:
A2, K58, K272, K686.
Serine phosphorylated:
S3, S21, S29, S110, S163, S255, S264, S274, S289, S302, S306, S349, S360, S362, S367, S370, S379, S408, S413, S416, S497, S531, S535, S559, S561, S582, S583, S615, S631, S636, S646, S701, S815+, S952.
Threonine phosphorylated:
T121, T124, T304, T516, T533, T628, T814+, T816+, T820-, T958+.
Tyrosine phosphorylated:
Y273, Y318, Y624, Y635, Y676, Y810.
Ubiquitinated:
K784.
Distribution
Based on gene microarray analysis from the NCBI
Human Tissue Distribution
% Max Expression:
Mean Expression:
Number of Samples:
Standard Deviation:
% Max Expression:
Mean Expression:
Number of Samples:
Standard Deviation:
 100
100
1080
48
1135
 11
11
119
23
106
 26
26
284
24
277
 27
27
295
168
468
 66
66
708
46
693
 74
74
796
128
2913
 36
36
392
57
616
 67
67
719
70
1344
 80
80
865
24
692
 14
14
149
161
163
 15
15
161
54
181
 60
60
645
273
635
 13
13
135
57
175
 19
19
208
18
286
 10
10
106
25
83
 8
8
90
28
78
 17
17
184
293
1140
 18
18
194
37
220
 9
9
99
156
96
 57
57
613
190
666
 17
17
179
43
192
 23
23
244
48
275
 24
24
257
35
293
 13
13
144
37
166
 20
20
220
43
256
 72
72
775
108
1134
 14
14
150
60
186
 21
21
222
37
452
 25
25
271
37
291
 9
9
98
56
138
 55
55
598
30
610
 44
44
479
56
500
 26
26
276
97
384
 88
88
950
109
842
 15
15
163
61
214
Evolution
Species Conservation
PhosphoNET % Identity:
PhosphoNET % Similarity:
Homologene %
Identity:
PhosphoNET % Identity:
PhosphoNET % Similarity:
Homologene %
Identity:
 100
100
100
100 99.7
99.7
99.9
100 46.2
46.2
63.2
98 -
-
-
97 -
-
-
99 92.8
92.8
94.7
97 -
-
-
- 94.6
94.6
97.3
95 92.7
92.7
95.3
95 -
-
-
- 54
54
68.3
- 87.1
87.1
91.9
91 -
-
-
86 76.4
76.4
85.1
80 -
-
-
- 28.4
28.4
42.4
62 -
-
-
- 27.6
27.6
43.7
41.5 48.5
48.5
61.4
- -
-
-
- -
-
-
- -
-
-
- -
-
-
- 26.1
26.1
45.6
- 27.2
27.2
46
-
For a wider analysis go to PhosphoNET Evolution in PhosphoNET
Binding Proteins
Examples of known interacting proteins
hiddentext
| No. | Name – UniProt ID |
|---|---|
| 1 | NCK1 - P16333 |
| 2 | AKT1 - P31749 |
| 3 | CASP3 - P42574 |
| 4 | PDK1 - Q15118 |
| 5 | NCK2 - O43639 |
| 6 | TOP2B - Q02880 |
Regulation
Activation:
Activated by lipids, particularly cardiolipin and to a lesser extent by other acidic phospholipids and unsaturated fatty acids. Phosphorylation at Thr-816 (activation loop of the kinase domain) and Thr-958 (turn motif) increases phosphotransferase activity.
Inhibition:
NA
Synthesis:
NA
Degradation:
NA
Known Upstream Kinases
For further details on these substrates click on the Substrate Short Name or UniProt ID. Phosphosite Location is hyperlinked to PhosphoNET
predictions.
Based on in vitro and/or in vivo phosphorylation data
| Kinase Short Name | UniProt ID (Human) | Phosphosite Location | Phosphosite Sequence | Effect of Phosphorylation |
|---|
Protein Kinase Specificity
Matrix of observed frequency (%) of amino acids in aligned protein substrate phosphosites
Matrix Type:
Predicted from the application of the Kinexus Kinase Substrate Predictor Version 2.0 algorithm, which was trained with over 10,000 kinase-protein substrate pairs and 8,000 kinase-peptide substrate pairs.
Domain #:
1
Inhibitors
For further details on these inhibitors click on the Compound Name and enter it into DrugKiNET or click on the ID's
Based on in vitro and/or in vivo phosphorylation data
| Compound Name | KD, Ki or IC50 (nM) | PubChem ID | ChEMBL ID | PubMed ID |
|---|
Disease Linkage
Gene Expression in Cancers:
TranscriptoNET (www.transcriptonet.ca) analysis with mRNA expression data retrieved from the National Center for Biotechnology Information's Gene Expression Omnibus (GEO) database, which was normalized against 60 abundantly and commonly found proteins, indicated altered expression for this protein kinase as shown here as the percent change from normal tissue controls (%CFC) as supported with the Student T-test in the following types of human cancers: Bladder carcinomas (%CFC= +83, p<0.022); Clear cell renal cell carcinomas (cRCC) stage I (%CFC= -68, p<0.0005); Ovary adenocarcinomas (%CFC= -47, p<0.015); Prostate cancer - primary (%CFC= +61, p<0.0001); Skin melanomas - malignant (%CFC= +133, p<0.0001); Uterine leiomyomas (%CFC= -50, p<0.07); and Uterine leiomyosarcomas (%CFC= -52, p<0.067). The COSMIC website notes an up-regulated expression score for PKN2 in diverse human cancers of 319, which is 0.7-fold of the average score of 462 for the human protein kinases. The down-regulated expression score of 241 for this protein kinase in human cancers was 4-fold of the average score of 60 for the human protein kinases.
Mutagenesis Experiments:
Insertional mutagenesis studies in mice support a role for this protein kinase in mouse cancer oncogenesis.
Mutation Rate in All Cancers:
Percent mutation rates per 100 amino acids length in human cancers: 0.06 % in 24915 diverse cancer specimens. This rate is only -25 % lower than the average rate of 0.075 % calculated for human protein kinases in general.
Mutation Rate in Specific Cancers:
Highest percent mutation rates per 100 amino acids length in human cancers: 0.24 % in 603 endometrium cancers tested; 0.24 % in 589 stomach cancers tested; 0.21 % in 1270 large intestine cancers tested; 0.15 % in 864 skin cancers tested; 0.15 % in 548 urinary tract cancers tested; 0.11 % in 273 cervix cancers tested; 0.11 % in 1512 liver cancers tested; 0.07 % in 1823 lung cancers tested; 0.06 % in 1276 kidney cancers tested; 0.05 % in 1316 breast cancers tested; 0.04 % in 942 upper aerodigestive tract cancers tested; 0.03 % in 881 prostate cancers tested; 0.03 % in 710 oesophagus cancers tested; 0.02 % in 558 thyroid cancers tested; 0.02 % in 441 autonomic ganglia cancers tested; 0.01 % in 833 ovary cancers tested; 0.01 % in 2082 central nervous system cancers tested; 0.01 % in 2009 haematopoietic and lymphoid cancers tested; 0.01 % in 1459 pancreas cancers tested.
Frequency of Mutated Sites:
Most frequent mutations with the number of reports indicated in brackets: R580Q (3); R940* (3).
Comments:
Only 8 deletions, 2 insertions and no complex mutations are noted on the COSMIC website.