
Nomenclature
Short Name:
PYK2
Full Name:
Protein tyrosine kinase 2 beta
Alias:
- CADTK
- EC 2.7.10.2
- FADK 2
- FADK2, FAK2
- FAK2
- Related adhesion focal tyrosine kinase; RAFTK
- CAK beta
- CAKB
- Calcium-dependent tyrosine kinase
- Cell adhesion kinase beta
Classification
Type:
Protein-tyrosine kinase
Group:
TK
Family:
Fak
SubFamily:
NA

Specific Links
Structure
Mol. Mass (Da):
115,875
# Amino Acids:
1009
# mRNA Isoforms:
2
mRNA Isoforms:
115,875 Da (1009 AA; Q14289); 111,183 Da (967 AA; Q14289-2)
4D Structure:
Interacts with Crk-associated substrate (Cas), PTPNS1 and SH2D3C By similarity. Interacts with nephrocystin, ASAP2, OPHN1L, SKAP2 and TGFB1I1.
1D Structure:
3D Image (rendered using PV Viewer):
PDB ID
Subfamily Alignment
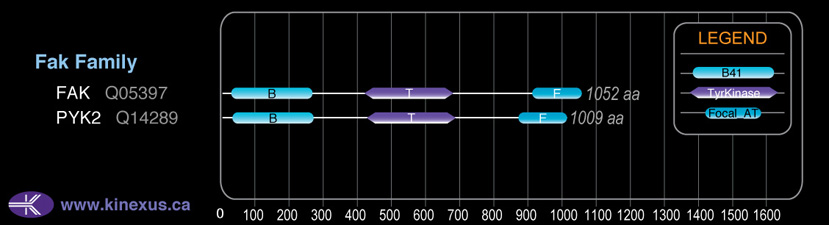
Domain Distribution:
Kinexus Products
Click on entries below for direct links to relevant products from Kinexus for this protein kinase.
hiddentext
Post-translation Modifications
For detailed information on phosphorylation of this kinase go to PhosphoNET
Acetylated:
K564.
Serine phosphorylated:
S2, S9, S332, S361, S375, S394, S396, S399, S473, S530, S559, S571, S583+, S718, S746, S747, S752, S758, S762, S778, S828, S839, S866, S923.
Threonine phosphorylated:
T15, T409, T701, T749, T765, T842, T853.
Tyrosine phosphorylated:
Y402+, Y418, Y440, Y573+, Y579+, Y580+, Y683, Y699, Y722, Y756, Y819, Y834, Y849, Y881, Y906+.
Ubiquitinated:
K188, K206, K564, K858, K911, K944, K973.
Distribution
Based on gene microarray analysis from the NCBI
Human Tissue Distribution
% Max Expression:
Mean Expression:
Number of Samples:
Standard Deviation:
% Max Expression:
Mean Expression:
Number of Samples:
Standard Deviation:
 81
81
1048
32
1886
 3
3
34
16
27
 15
15
189
32
427
 40
40
525
119
910
 47
47
607
24
524
 2
2
28
74
28
 31
31
400
35
640
 26
26
341
60
542
 29
29
378
17
316
 12
12
160
114
247
 10
10
125
53
278
 44
44
575
216
592
 23
23
293
54
321
 3
3
33
15
29
 7
7
87
19
69
 3
3
34
16
24
 6
6
84
225
159
 12
12
155
43
257
 3
3
34
113
72
 34
34
436
109
467
 11
11
149
47
280
 16
16
208
51
213
 15
15
198
42
338
 14
14
178
43
514
 26
26
335
47
402
 33
33
424
76
569
 13
13
167
57
182
 13
13
171
43
316
 9
9
122
43
237
 43
43
558
28
452
 52
52
677
36
490
 100
100
1300
36
2635
 6
6
81
72
121
 61
61
795
57
703
 3
3
36
44
38
Evolution
Species Conservation
PhosphoNET % Identity:
PhosphoNET % Similarity:
Homologene %
Identity:
PhosphoNET % Identity:
PhosphoNET % Similarity:
Homologene %
Identity:
 100
100
100
100 99.6
99.6
99.8
99.5 98.8
98.8
99.6
99 -
-
-
95 -
-
-
95 96.2
96.2
98.8
96 -
-
-
- 95.5
95.5
98.1
95 95.6
95.6
98.1
94 -
-
-
- 63.1
63.1
70.1
- 44.8
44.8
62.2
80 43.8
43.8
61.8
77 59.4
59.4
75.1
- -
-
-
- -
-
-
- -
-
-
- -
-
-
- -
-
-
- -
-
-
- -
-
-
- -
-
-
- -
-
-
- -
-
-
- -
-
-
-
For a wider analysis go to PhosphoNET Evolution in PhosphoNET
Binding Proteins
Examples of known interacting proteins
hiddentext
| No. | Name – UniProt ID |
|---|---|
| 1 | BCAR1 - P56945 |
| 2 | PTPN12 - Q05209 |
| 3 | PTPN6 - P29350 |
| 4 | CBL - P22681 |
| 5 | EGFR - P00533 |
| 6 | EFS - O43281 |
| 7 | DCC - P43146 |
| 8 | SH2D3C - Q8N5H7 |
| 9 | RB1CC1 - Q8TDY2 |
| 10 | KCNA2 - P16389 |
| 11 | IL7R - P16871 |
| 12 | ITGB3 - P05106 |
| 13 | FLT1 - P17948 |
| 14 | STAT3 - P40763 |
| 15 | ERBB3 - P21860 |
Regulation
Activation:
Phosphorylation at Tyr-402 increases phosphotransferase activity and induces interaction with ErbB2, RasGAP and Src. Phosphorylation at Tyr-579 increases phosphotransferase activity.
Inhibition:
NA
Synthesis:
NA
Degradation:
NA
Known Upstream Kinases
For further details on these substrates click on the Substrate Short Name or UniProt ID. Phosphosite Location is hyperlinked to PhosphoNET
predictions.
Based on in vitro and/or in vivo phosphorylation data
| Kinase Short Name | UniProt ID (Human) | Phosphosite Location | Phosphosite Sequence | Effect of Phosphorylation |
|---|
Known Downstream Substrates
For further details on these substrates click on the Substrate Short Name or UniProt ID. Phosphosite Location is hyperlinked to PhosphoNET
predictions.
Based on in vitro and/or in vivo phosphorylation data
| Substrate Short Name | UniProt ID (Human) | Phosphosite Location | Phosphosite Sequence | Effect of Phosphorylation |
|---|
| ARA55 (Hic-5) | O43294 | Y60 | SGDKDHLYSTVCKPR | - |
| DDEF1 | Q9ULH1 | Y767 | RDKQRLSYGAFTNQI | |
| eNOS | P29474 | Y657 | FGLGSRAYPHFCAFA | |
| FAK (PTK2) | Q05397 | Y407 | IIDEEDTYTMPSTRD | + |
| Hic-5 | O43294 | Y60 | SGDKDHLYSTVCKPR | - |
| JAK2 | O60674 | Y1007 | VLPQDKEYYKVKEPG | + |
| JAK2 | O60674 | Y1008 | LPQDKEYYKVKEPGE | + |
| PXN | P49023 | Y118 | VGEEEHVYSFPNKQK | |
| PXN | P49023 | Y31 | FLSEETPYSYPTGNH | |
| PYK2 (PTK2B) | Q14289 | Y402 | CSIESDIYAEIPDET | + |
| SNCA | P37840 | Y125 | VDPDNEAYEMPSEEG | |
| Src | P12931 | Y419 | RLIEDNEYTARQGAK | + |
| TGFb1I1 | O43294 | Y60 | SGDKDHLYSTVCKPR | - |
Protein Kinase Specificity
Matrix of observed frequency (%) of amino acids in aligned protein substrate phosphosites
Matrix Type:
Experimentally derived from alignment of 22 known protein substrate phosphosites and 43 peptides phosphorylated by recombinant PYK2 in vitro tested in-house by Kinexus.
Domain #:
1
Inhibitors
For further details on these inhibitors click on the Compound Name and enter it into DrugKiNET or click on the ID's
Based on in vitro and/or in vivo phosphorylation data
| Compound Name | KD, Ki or IC50 (nM) | PubChem ID | ChEMBL ID | PubMed ID |
|---|
Disease Linkage
General Disease Association:
Cancer
Specific Cancer Types:
Gliomas; Hepatocellular carcinomas; Lung cancer (LC); Breast cancer
Gene Expression in Cancers:
The COSMIC website notes an up-regulated expression score for PYK2 in diverse human cancers of 278, which is 0.6-fold of the average score of 462 for the human protein kinases. The down-regulated expression score of 55 for this protein kinase in human cancers was 0.9-fold of the average score of 60 for the human protein kinases.
Mutagenesis Experiments:
Insertional mutagenesis studies in mice support a role for this protein kinase in mouse cancer oncogenesis. PYK2 autophosphorylation and interaction with Src can be inhibited with an Y402F mutation. Its phosphotransferase activity can be abrogated with a K457A mutation. NPHP1 interaction with PYK2 can be interrupted with a P859A mutation. A Y881F mutation can impair interaction with the GRB2 adapter protein.
Mutation Rate in All Cancers:
Percent mutation rates per 100 amino acids length in human cancers: 0.08 % in 25546 diverse cancer specimens. This rate is very similar (+ 10% higher) to the average rate of 0.075 % calculated for human protein kinases in general.
Mutation Rate in Specific Cancers:
Highest percent mutation rates per 100 amino acids length in human cancers: 0.57 % in 944 skin cancers tested; 0.35 % in 589 stomach cancers tested; 0.27 % in 1270 large intestine cancers tested; 0.21 % in 603 endometrium cancers tested; 0.17 % in 238 bone cancers tested; 0.15 % in 1634 lung cancers tested; 0.08 % in 891 ovary cancers tested; 0.06 % in 710 oesophagus cancers tested; 0.06 % in 1512 liver cancers tested; 0.06 % in 1490 breast cancers tested; 0.05 % in 548 urinary tract cancers tested; 0.04 % in 558 thyroid cancers tested; 0.04 % in 273 cervix cancers tested; 0.04 % in 2082 central nervous system cancers tested.
Frequency of Mutated Sites:
Most frequent mutations with the number of reports indicated in brackets: R671C (3).
Comments:
Only 6 deletions, no insertions or complex mutations are noted on the COSMIC website.