
Nomenclature
Short Name:
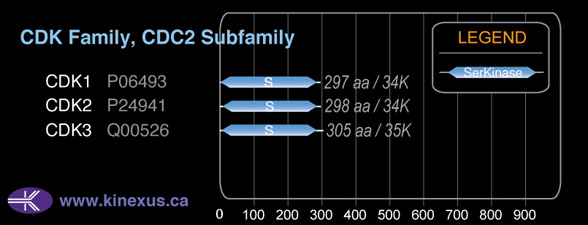
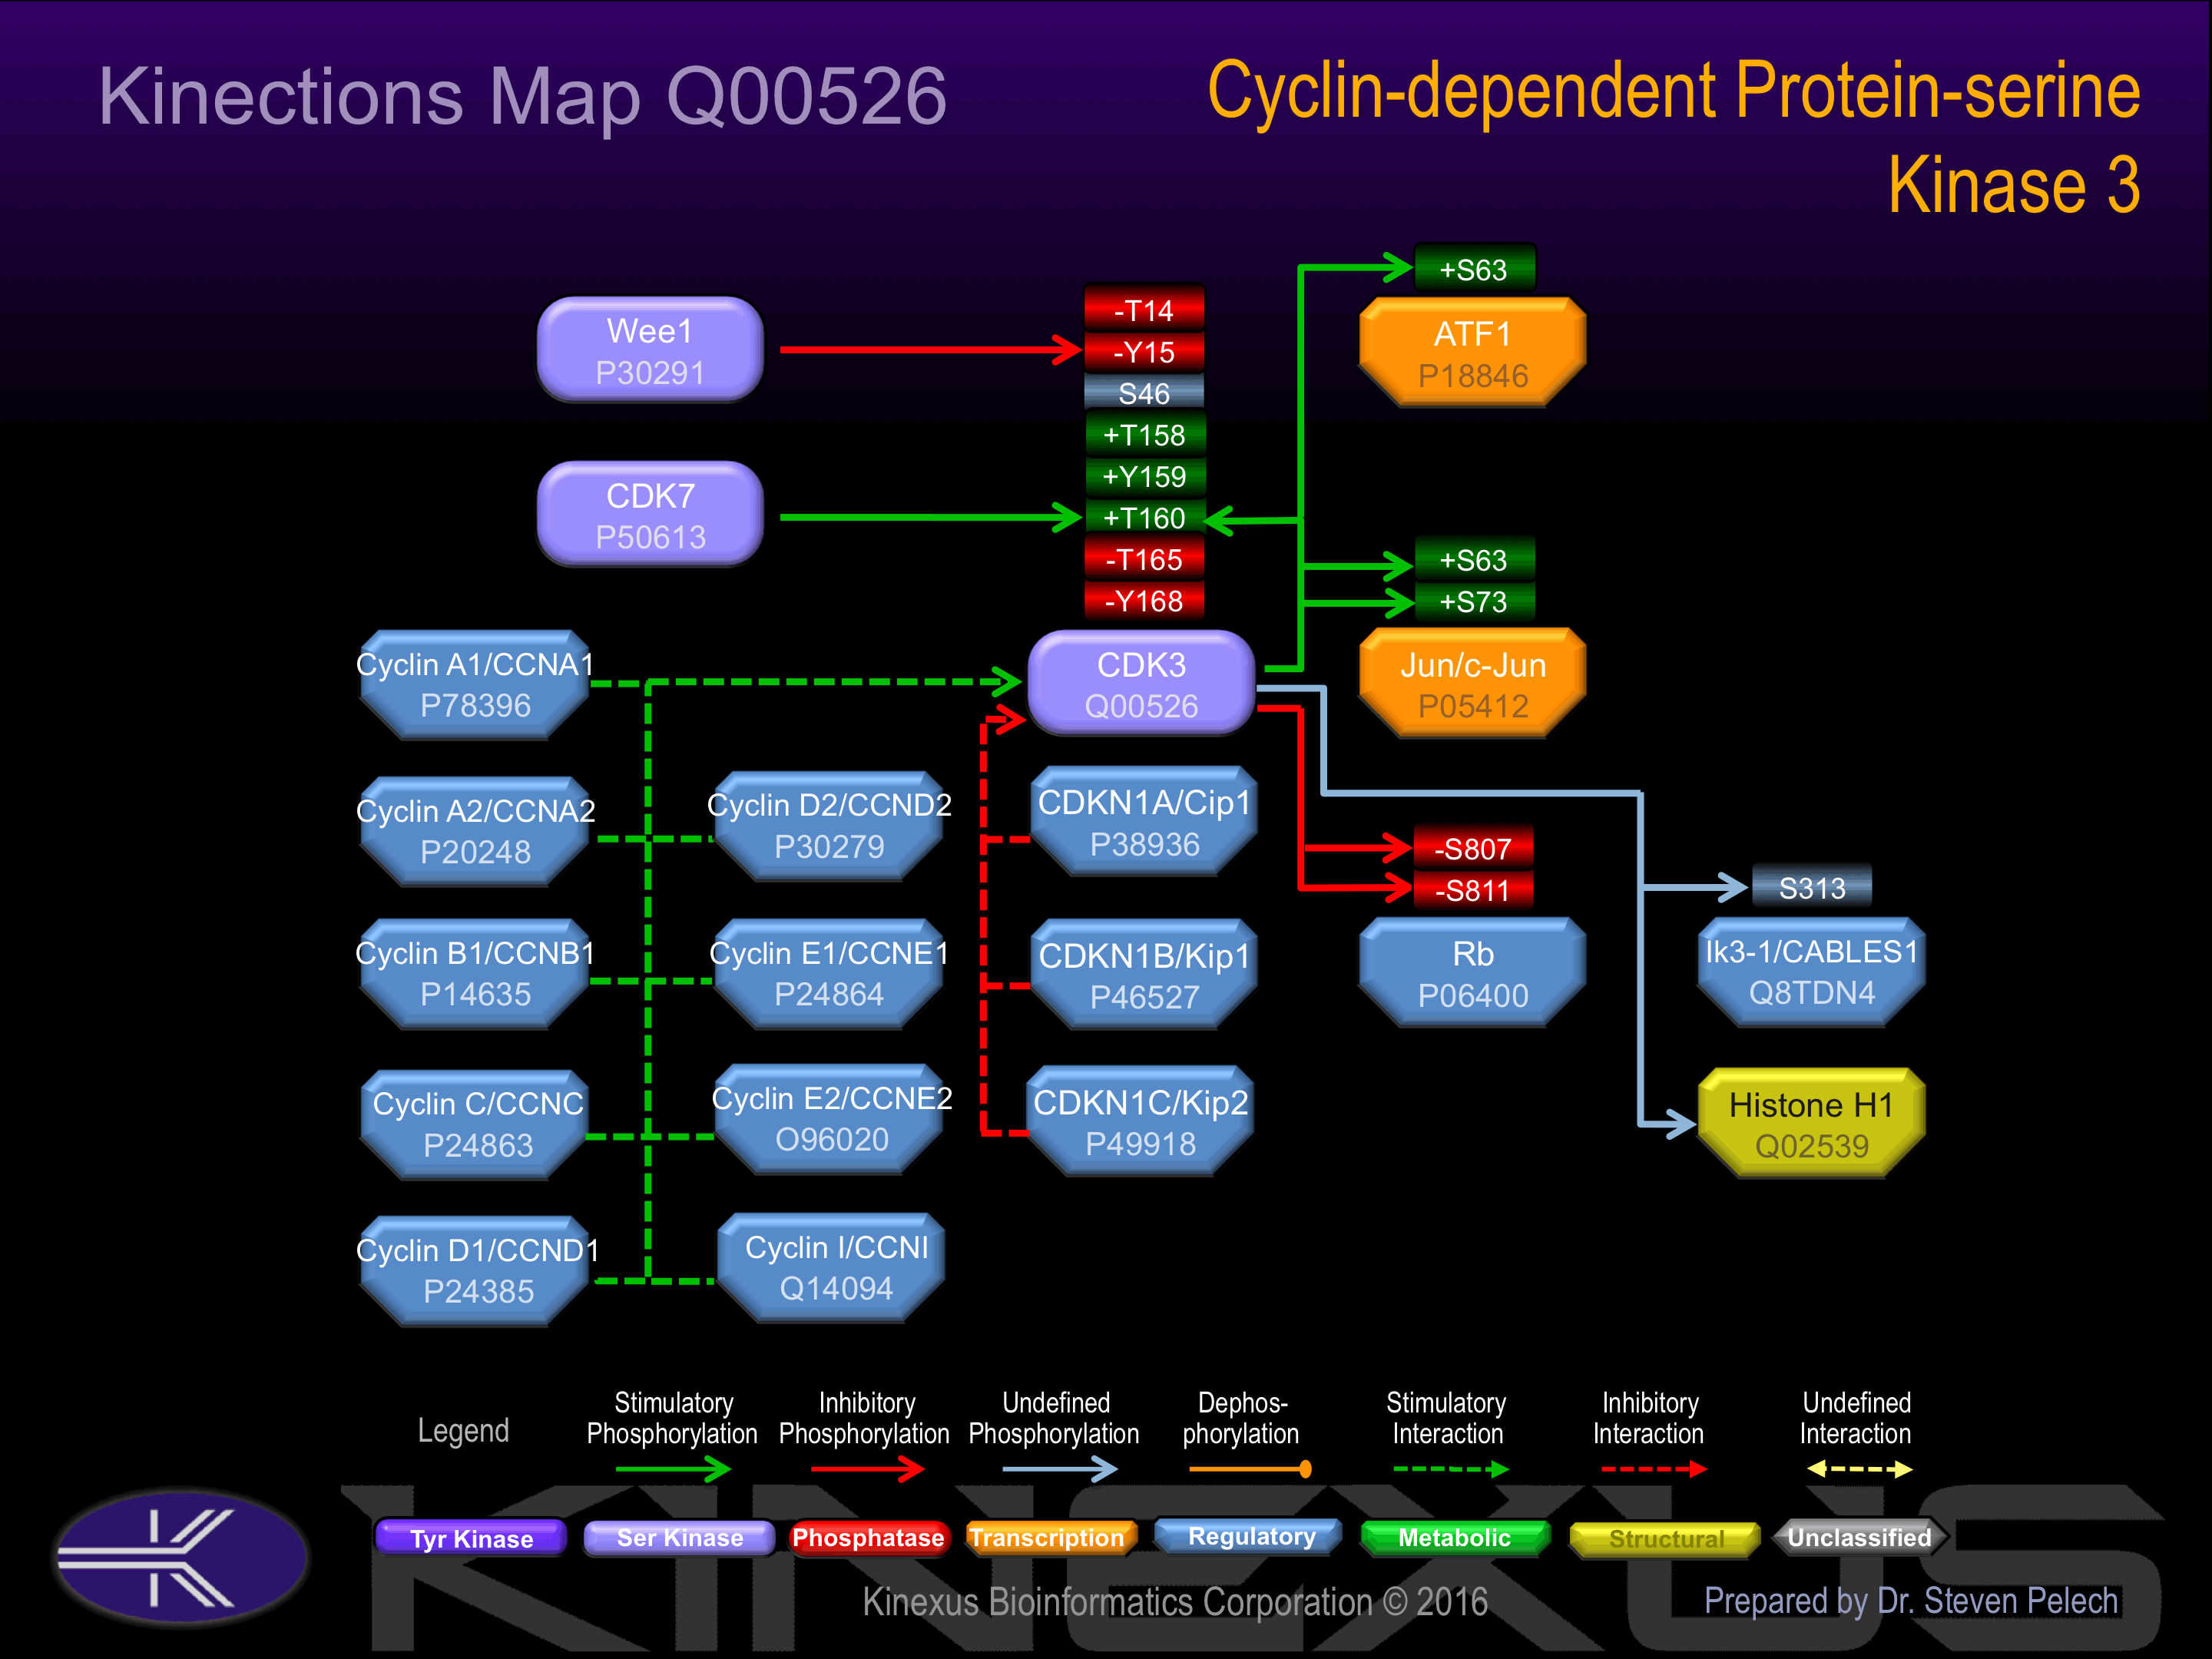
CDK3
Full Name:
Cyclin-dependent kinase 3
Alias:
- EC 2.7.11.22
Classification
Type:
Protein-serine/threonine kinase
Group:
CMGC
Family:
CDK
SubFamily:
CDC2

Specific Links
Structure
Mol. Mass (Da):
35,046
# Amino Acids:
305
# mRNA Isoforms:
1
mRNA Isoforms:
35,046 Da (305 AA; Q00526)
4D Structure:
Interacts with CABLES1
1D Structure:
Subfamily Alignment
Domain Distribution:
| Start | End | Domain |
|---|---|---|
| 4 | 286 | Pkinase |
Kinexus Products
Click on entries below for direct links to relevant products from Kinexus for this protein kinase.
hiddentext
Post-translation Modifications
For detailed information on phosphorylation of this kinase go to PhosphoNET
Serine phosphorylated:
S207, S272.
Threonine phosphorylated:
T14-, T158+, T160+, T198.
Tyrosine phosphorylated:
Y15-, Y19, Y159+, Y168-, Y236.
Ubiquitinated:
K9, K33.
Distribution
Based on gene microarray analysis from the NCBI
Human Tissue Distribution
% Max Expression:
Mean Expression:
Number of Samples:
Standard Deviation:
% Max Expression:
Mean Expression:
Number of Samples:
Standard Deviation:
 45
45
1443
22
2106
 1.3
1.3
42
11
35
 3
3
90
7
99
 6
6
209
80
382
 17
17
543
24
549
 22
22
694
54
1722
 13
13
414
33
578
 17
17
538
29
775
 6
6
205
10
172
 6
6
183
80
160
 2
2
65
23
50
 14
14
466
129
565
 2
2
62
18
60
 1.1
1.1
36
9
16
 2
2
77
19
65
 1.4
1.4
44
14
26
 2
2
49
268
52
 2
2
50
14
47
 2
2
51
73
32
 15
15
482
84
491
 2
2
69
20
58
 3
3
86
20
83
 2
2
74
8
56
 2
2
54
14
51
 2
2
80
19
80
 28
28
897
50
1078
 1.1
1.1
36
21
31
 2
2
72
14
78
 2
2
58
13
65
 4
4
142
28
87
 17
17
556
18
401
 100
100
3226
26
6647
 2
2
68
58
252
 26
26
830
52
709
 2
2
66
35
54
Evolution
Species Conservation
PhosphoNET % Identity:
PhosphoNET % Similarity:
Homologene %
Identity:
PhosphoNET % Identity:
PhosphoNET % Similarity:
Homologene %
Identity:
 100
100
100
100 93.5
93.5
93.5
100 96.7
96.7
98.4
97 -
-
-
89 -
-
-
- 88.5
88.5
92.8
92 -
-
-
- 82.6
82.6
91.8
- 74.8
74.8
84.6
99 -
-
-
- -
-
-
- 63.6
63.6
78
81 73.8
73.8
84.6
90 73.8
73.8
83.3
- -
-
-
- 63
63
76.7
- 67.2
67.2
80.7
- 58.1
58.1
69.6
- 69.5
69.5
82.6
- 65.3
65.3
81.6
- 64.3
64.3
81
- -
-
-
64 65.6
65.6
81.3
69 62.3
62.3
77.7
- -
-
-
-
For a wider analysis go to PhosphoNET Evolution in PhosphoNET
Binding Proteins
Examples of known interacting proteins
hiddentext
| No. | Name – UniProt ID |
|---|---|
| 1 | CDKN1B - P46527 |
| 2 | CCNC - P24863 |
| 3 | CCNA2 - P20248 |
| 4 | CKS1B - P61024 |
| 5 | CDC37 - Q16543 |
| 6 | CABLES1 - Q8TDN4 |
| 7 | CCNE1 - P24864 |
| 8 | KIR3DL2 - P43630 |
| 9 | KIR3DL1 - P43629 |
| 10 | E2F1 - Q01094 |
| 11 | CABLES2 - Q9BTV7 |
| 12 | TFDP1 - Q14186 |
| 13 | E2F2 - Q14209 |
| 14 | CDKN3 - Q16667 |
| 15 | CCNE2 - O96020 |
Regulation
Activation:
Phosphorylation at Thr-160 increases phosphotransferase activity.
Inhibition:
Phosphorylation at Thr-14 and Tyr-15 inhibits phosphotransferase activity.
Synthesis:
NA
Degradation:
NA
Known Downstream Substrates
For further details on these substrates click on the Substrate Short Name or UniProt ID. Phosphosite Location is hyperlinked to PhosphoNET
predictions.
Based on in vitro and/or in vivo phosphorylation data
| Substrate Short Name | UniProt ID (Human) | Phosphosite Location | Phosphosite Sequence | Effect of Phosphorylation |
|---|
Protein Kinase Specificity
Matrix of observed frequency (%) of amino acids in aligned protein substrate phosphosites
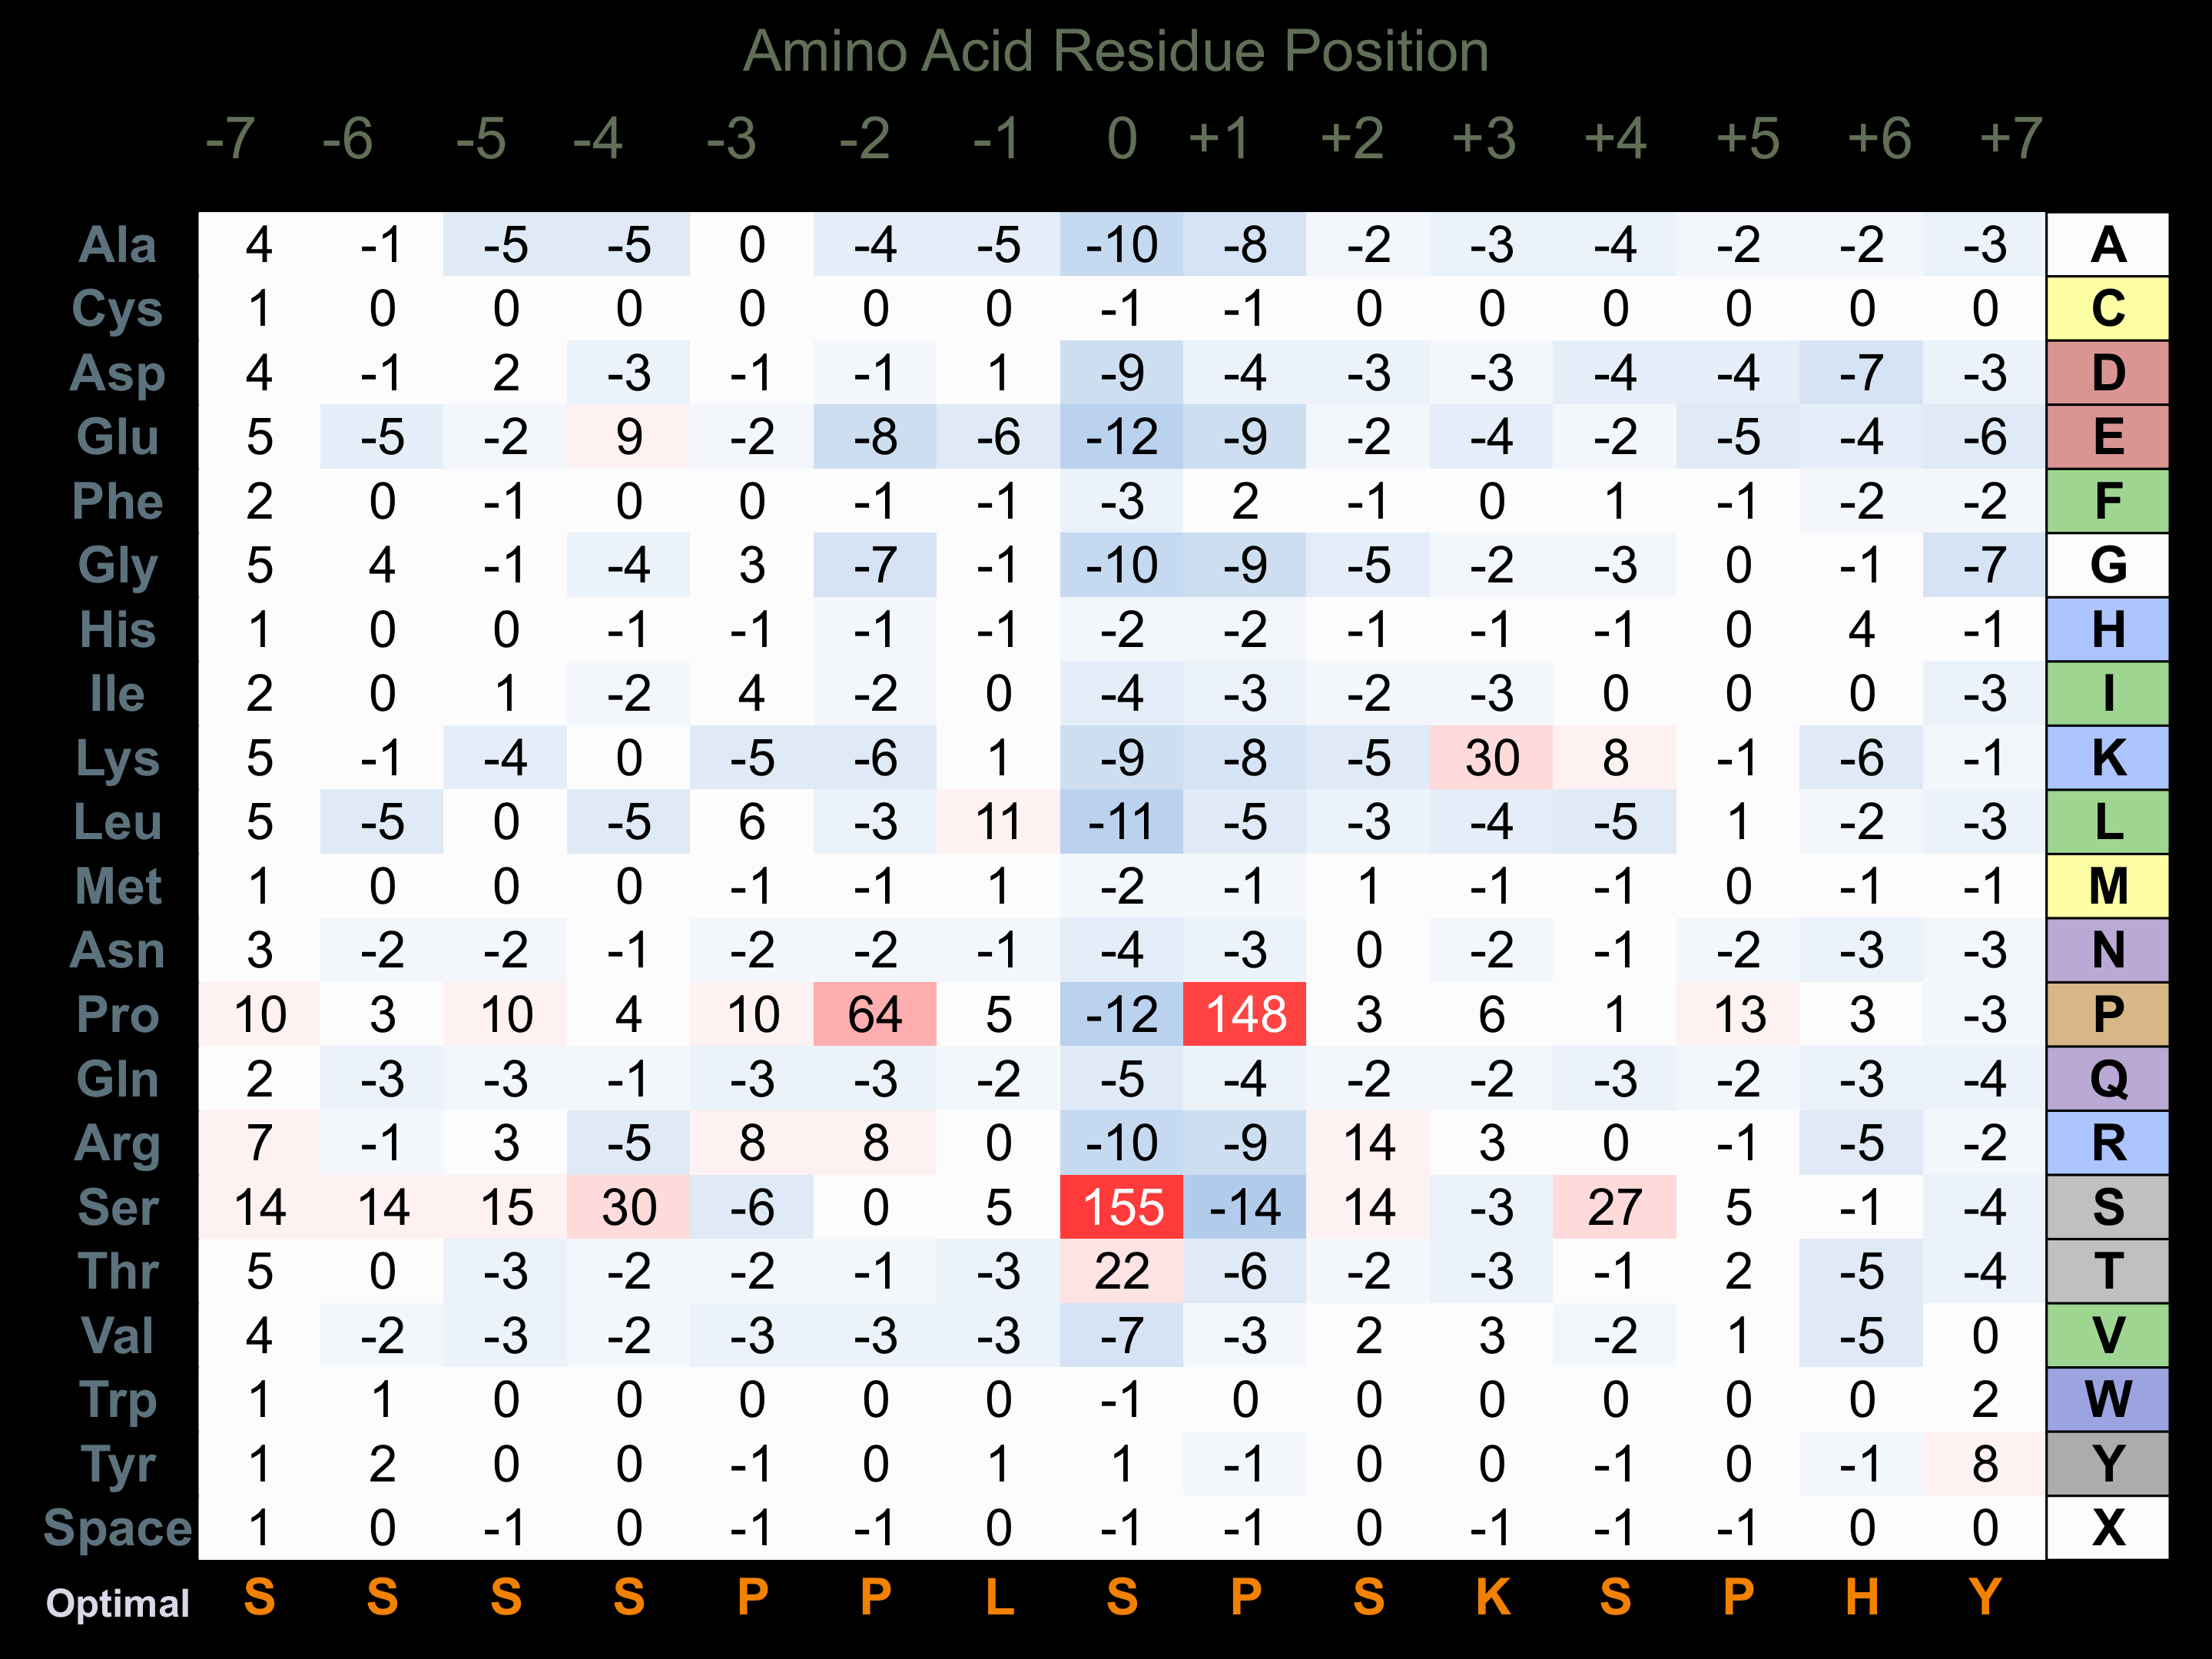
Matrix Type:
Predicted from the application of the Kinexus Kinase Substrate Predictor Version 2.0 algorithm, which was trained with over 10,000 kinase-protein substrate pairs and 8,000 kinase-peptide substrate pairs.
Domain #:
1
Inhibitors
For further details on these inhibitors click on the Compound Name and enter it into DrugKiNET or click on the ID's
Based on in vitro and/or in vivo phosphorylation data
| Compound Name | KD, Ki or IC50 (nM) | PubChem ID | ChEMBL ID | PubMed ID |
|---|
Disease Linkage
Comments:
CDK3 is expressed in cancer cell lines and glioblastoma tissue.
Gene Expression in Cancers:
TranscriptoNET (www.transcriptonet.ca) analysis with mRNA expression data retrieved from the National Center for Biotechnology Information's Gene Expression Omnibus (GEO) database, which was normalized against 60 abundantly and commonly found proteins, indicated altered expression for this protein kinase as shown here as the percent change from normal tissue controls (%CFC) as supported with the Student T-test in the following types of human cancers: Cervical cancer stage 2A (%CFC= +46, p<0.058); Clear cell renal cell carcinomas (cRCC) stage I (%CFC= +379, p<(0.0003); Colon mucosal cell adenomas (%CFC= -45, p<0.0004); Large B-cell lymphomas (%CFC= +64, p<0.051); Ovary adenocarcinomas (%CFC= +98, p<0.071); and Pituitary adenomas (ACTH-secreting) (%CFC= -48).
Mutagenesis Experiments:
Insertional mutagenesis studies in mice have not yet revealed a role for this protein kinase in mouse cancer oncogenesis.
Mutation Rate in All Cancers:
Percent mutation rates per 100 amino acids length in human cancers: 0.07 % in 24435 diverse cancer specimens. This rate is only -2 % lower and is very similar to the average rate of 0.075 % calculated for human protein kinases in general.
Mutation Rate in Specific Cancers:
Highest percent mutation rates per 100 amino acids length in human cancers: 0.49 % in 864 skin cancers tested; 0.32 % in 1229 large intestine cancers tested.
Frequency of Mutated Sites:
Most frequent mutations with the number of reports indicated in brackets: R169C (2).
Comments:
Only 2 deletions, 1 insertion, and no complex mutations are noted on the COSMIC website.