
Nomenclature
Short Name:
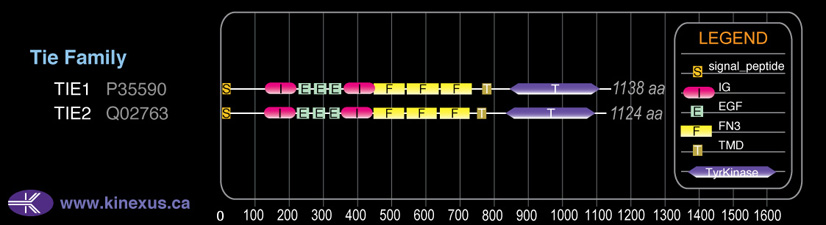
TIE2
Full Name:
Angiopoietin 1 receptor
Alias:
- Angiopoietin 1 receptor
- CD202b antigen
- VMCM
- VMCM1
- EC 2.7.10.1
- HYK
- P140 TEK
- TEK
Classification
Type:
Protein-tyrosine kinase
Group:
TK
Family:
Tie
SubFamily:
NA

Specific Links
Structure
Mol. Mass (Da):
125,830
# Amino Acids:
1124
# mRNA Isoforms:
3
mRNA Isoforms:
125,830 Da (1124 AA; Q02763); 121,048 Da (1081 AA; Q02763-2); 109,141 Da (976 AA; Q02763-3)
4D Structure:
Interacts with PTPRB
1D Structure:
3D Image (rendered using PV Viewer):
PDB ID
Subfamily Alignment
Domain Distribution:
Kinexus Products
Click on entries below for direct links to relevant products from Kinexus for this protein kinase.
hiddentext
Post-translation Modifications
For detailed information on phosphorylation of this kinase go to PhosphoNET
N-GlcNAcylated:
N140, N158, N399, N438, N464,N560, N596, N649,N691.
Serine phosphorylated:
S142, S164, S1119+.
Threonine phosphorylated:
T115, T996.
Tyrosine phosphorylated:
Y697, Y816, Y897-, Y899, Y976, Y992+, Y1048, Y1102+, Y1108+, Y1113.
Distribution
Based on gene microarray analysis from the NCBI
Human Tissue Distribution
% Max Expression:
Mean Expression:
Number of Samples:
Standard Deviation:
% Max Expression:
Mean Expression:
Number of Samples:
Standard Deviation:
 74
74
871
29
1145
 8
8
91
17
58
 31
31
361
24
274
 26
26
310
107
451
 54
54
639
22
483
 7
7
85
79
321
 28
28
330
35
577
 50
50
592
57
578
 30
30
360
17
294
 19
19
221
109
298
 14
14
160
45
218
 89
89
1052
208
1046
 24
24
279
45
376
 4
4
48
15
38
 12
12
146
39
190
 5
5
59
16
45
 5
5
59
218
129
 16
16
193
35
324
 13
13
158
112
223
 31
31
372
109
412
 16
16
186
39
217
 58
58
682
43
788
 30
30
356
34
381
 7
7
88
35
107
 13
13
158
39
239
 54
54
637
71
601
 10
10
113
48
158
 16
16
191
35
287
 42
42
495
35
506
 11
11
126
28
123
 28
28
327
24
319
 100
100
1181
42
4019
 0.3
0.3
4
34
2
 60
60
709
57
713
 6
6
65
35
45
Evolution
Species Conservation
PhosphoNET % Identity:
PhosphoNET % Similarity:
Homologene %
Identity:
PhosphoNET % Identity:
PhosphoNET % Similarity:
Homologene %
Identity:
 100
100
100
100 98.9
98.9
99.1
96 98.5
98.5
99.2
99 -
-
-
95 -
-
-
- 44.1
44.1
58
96 -
-
-
- 92.8
92.8
96
93 25.8
25.8
39.7
94 -
-
-
- 69.5
69.5
77.8
- 24.3
24.3
40.2
74 26.2
26.2
40.8
67 52.8
52.8
68
54 -
-
-
- 23.9
23.9
38.3
- 25.3
25.3
41.1
- -
-
-
- 22.7
22.7
39.6
- -
-
-
- -
-
-
- -
-
-
- -
-
-
- -
-
-
- -
-
-
-
For a wider analysis go to PhosphoNET Evolution in PhosphoNET
Regulation
Activation:
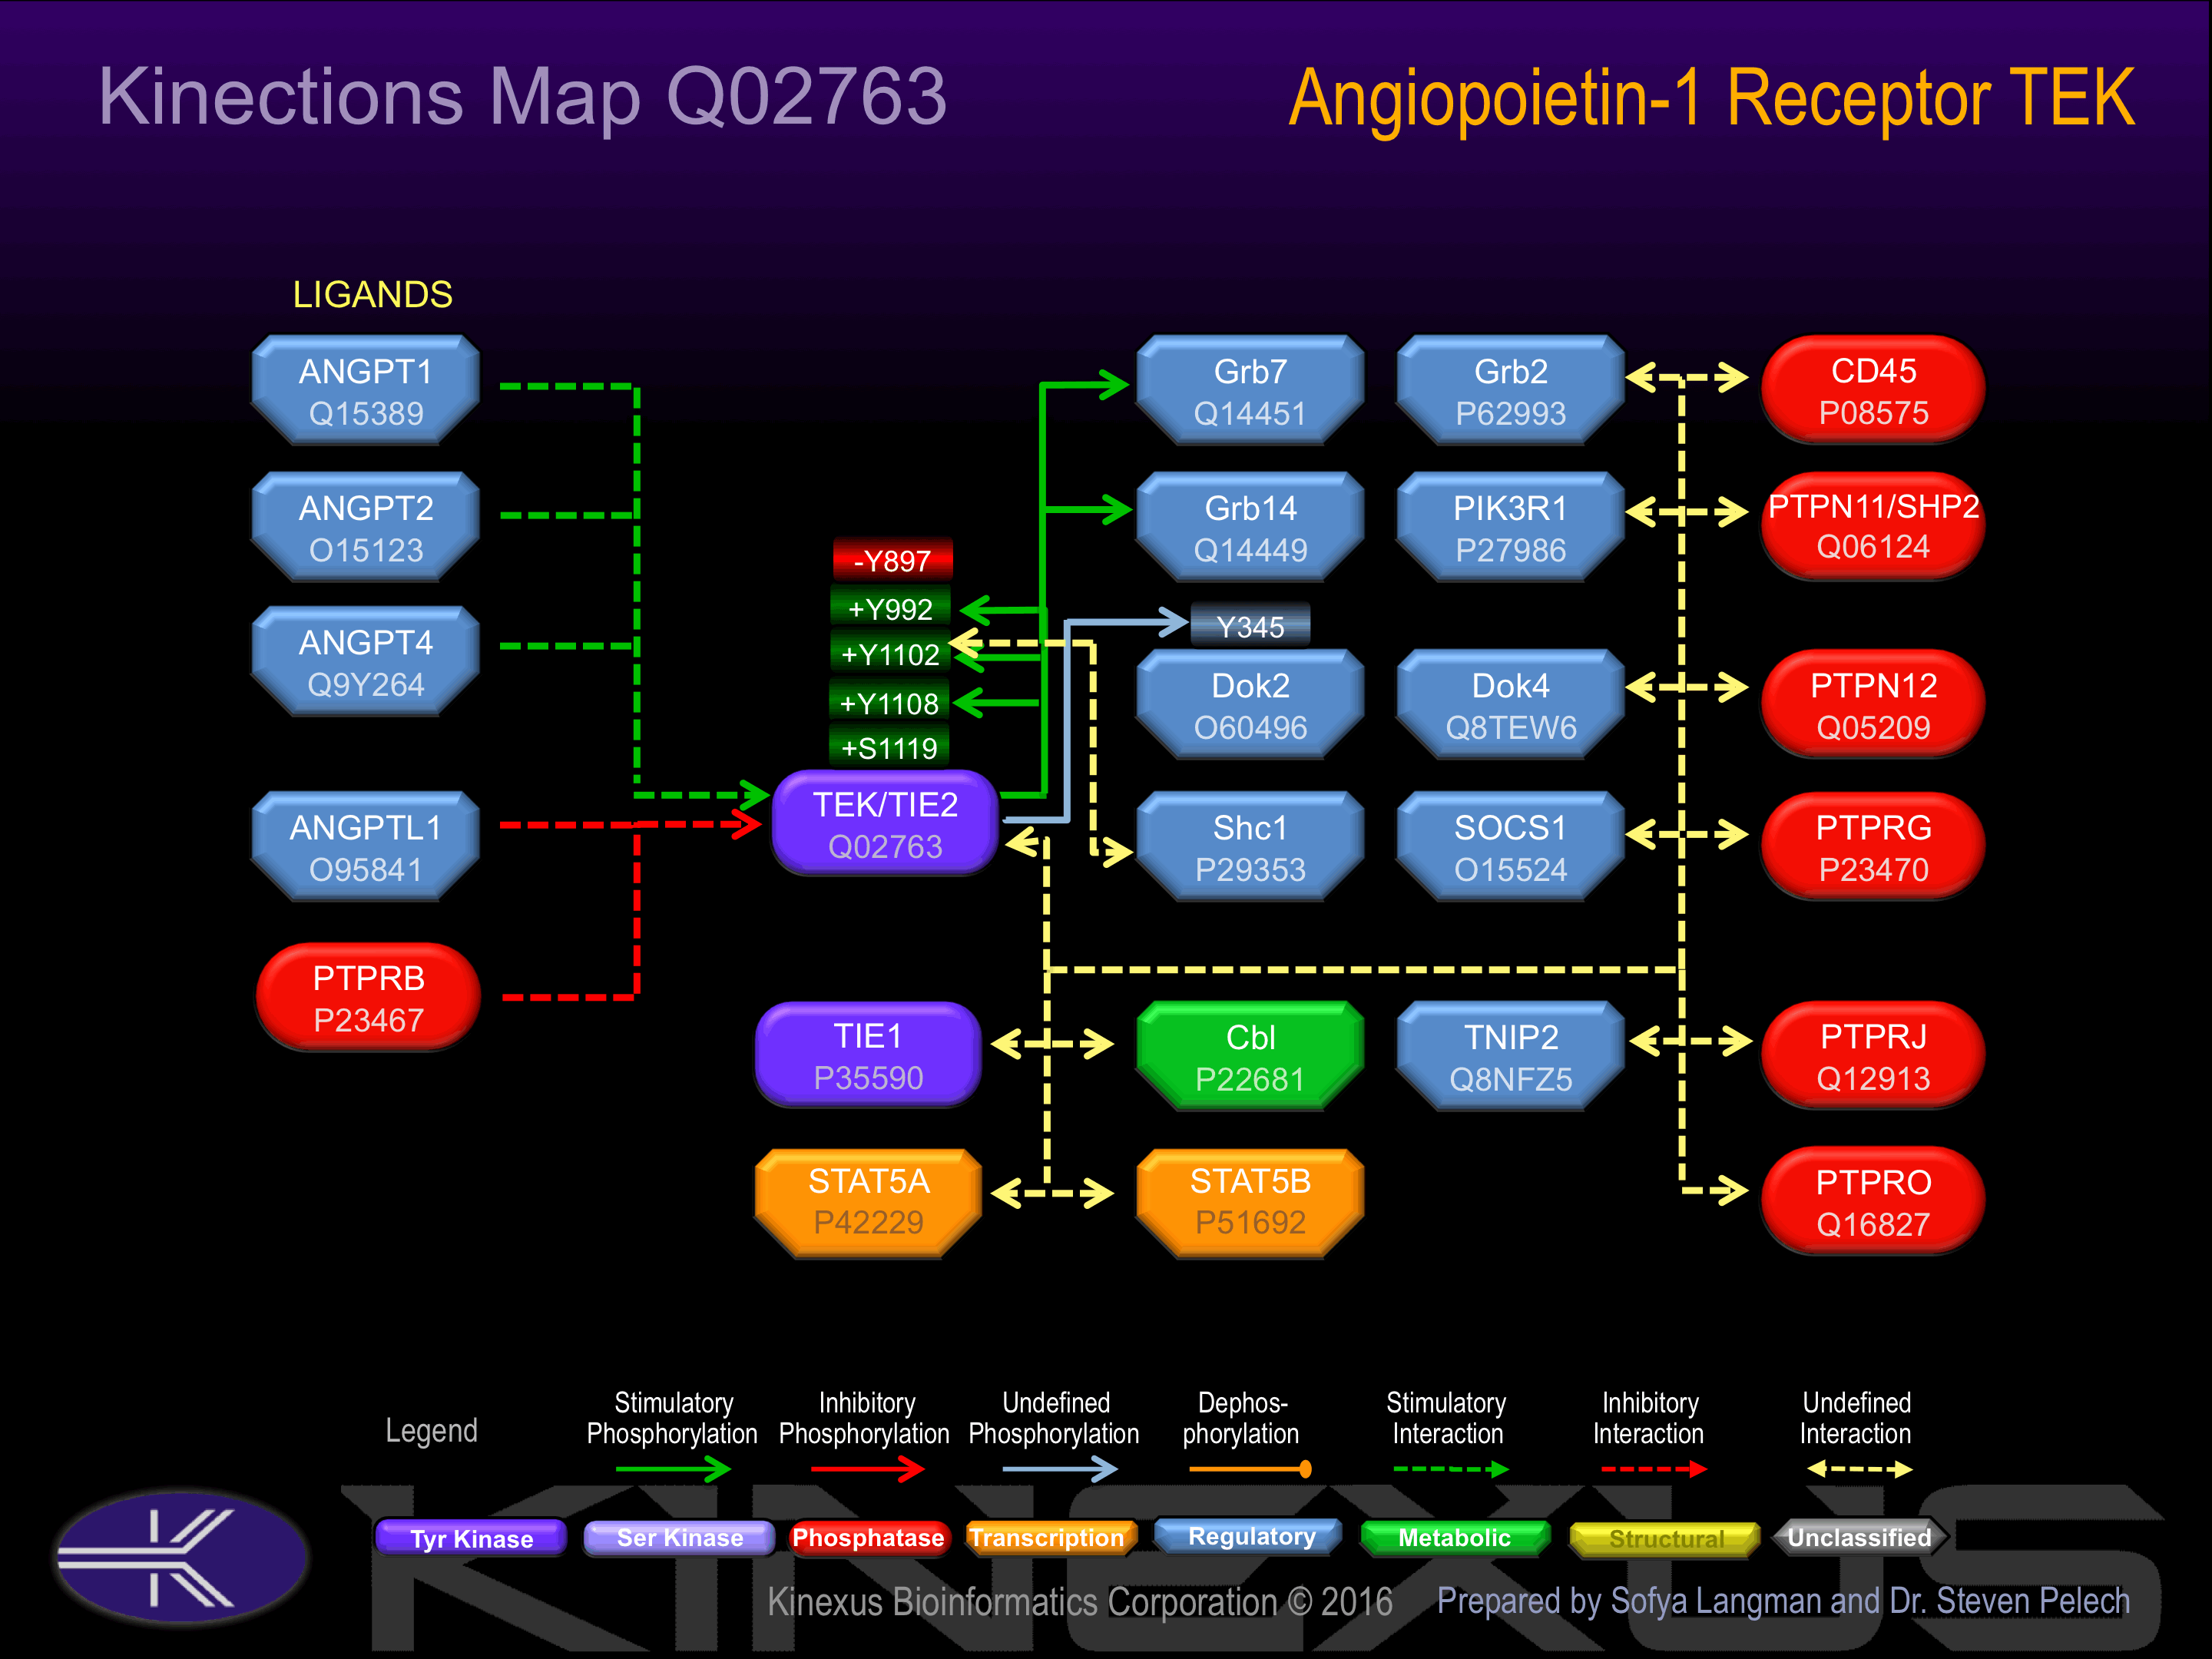
Activated by binding Angiopoietin 1.
Inhibition:
Phosphorylation at Tyr-897 inhibits phosphotransferase activity.
Synthesis:
NA
Degradation:
NA
Known Upstream Kinases
For further details on these substrates click on the Substrate Short Name or UniProt ID. Phosphosite Location is hyperlinked to PhosphoNET
predictions.
Based on in vitro and/or in vivo phosphorylation data
| Kinase Short Name | UniProt ID (Human) | Phosphosite Location | Phosphosite Sequence | Effect of Phosphorylation |
|---|
Known Downstream Substrates
For further details on these substrates click on the Substrate Short Name or UniProt ID. Phosphosite Location is hyperlinked to PhosphoNET
predictions.
Based on in vitro and/or in vivo phosphorylation data
| Substrate Short Name | UniProt ID (Human) | Phosphosite Location | Phosphosite Sequence | Effect of Phosphorylation |
|---|
| DOK2 | O60496 | Y345 | PPRPDHIYDEPEGVA | |
| Tie2 (TEK) | Q02763 | Y1102 | MLEERKTYVNTTLYE | + |
| Tie2 (TEK) | Q02763 | Y1108 | TYVNTTLYEKFTYAG | + |
| Tie2 (TEK) | Q02763 | Y992 | LSRGQEVYVKKTMGR | + |
Protein Kinase Specificity
Matrix of observed frequency (%) of amino acids in aligned protein substrate phosphosites
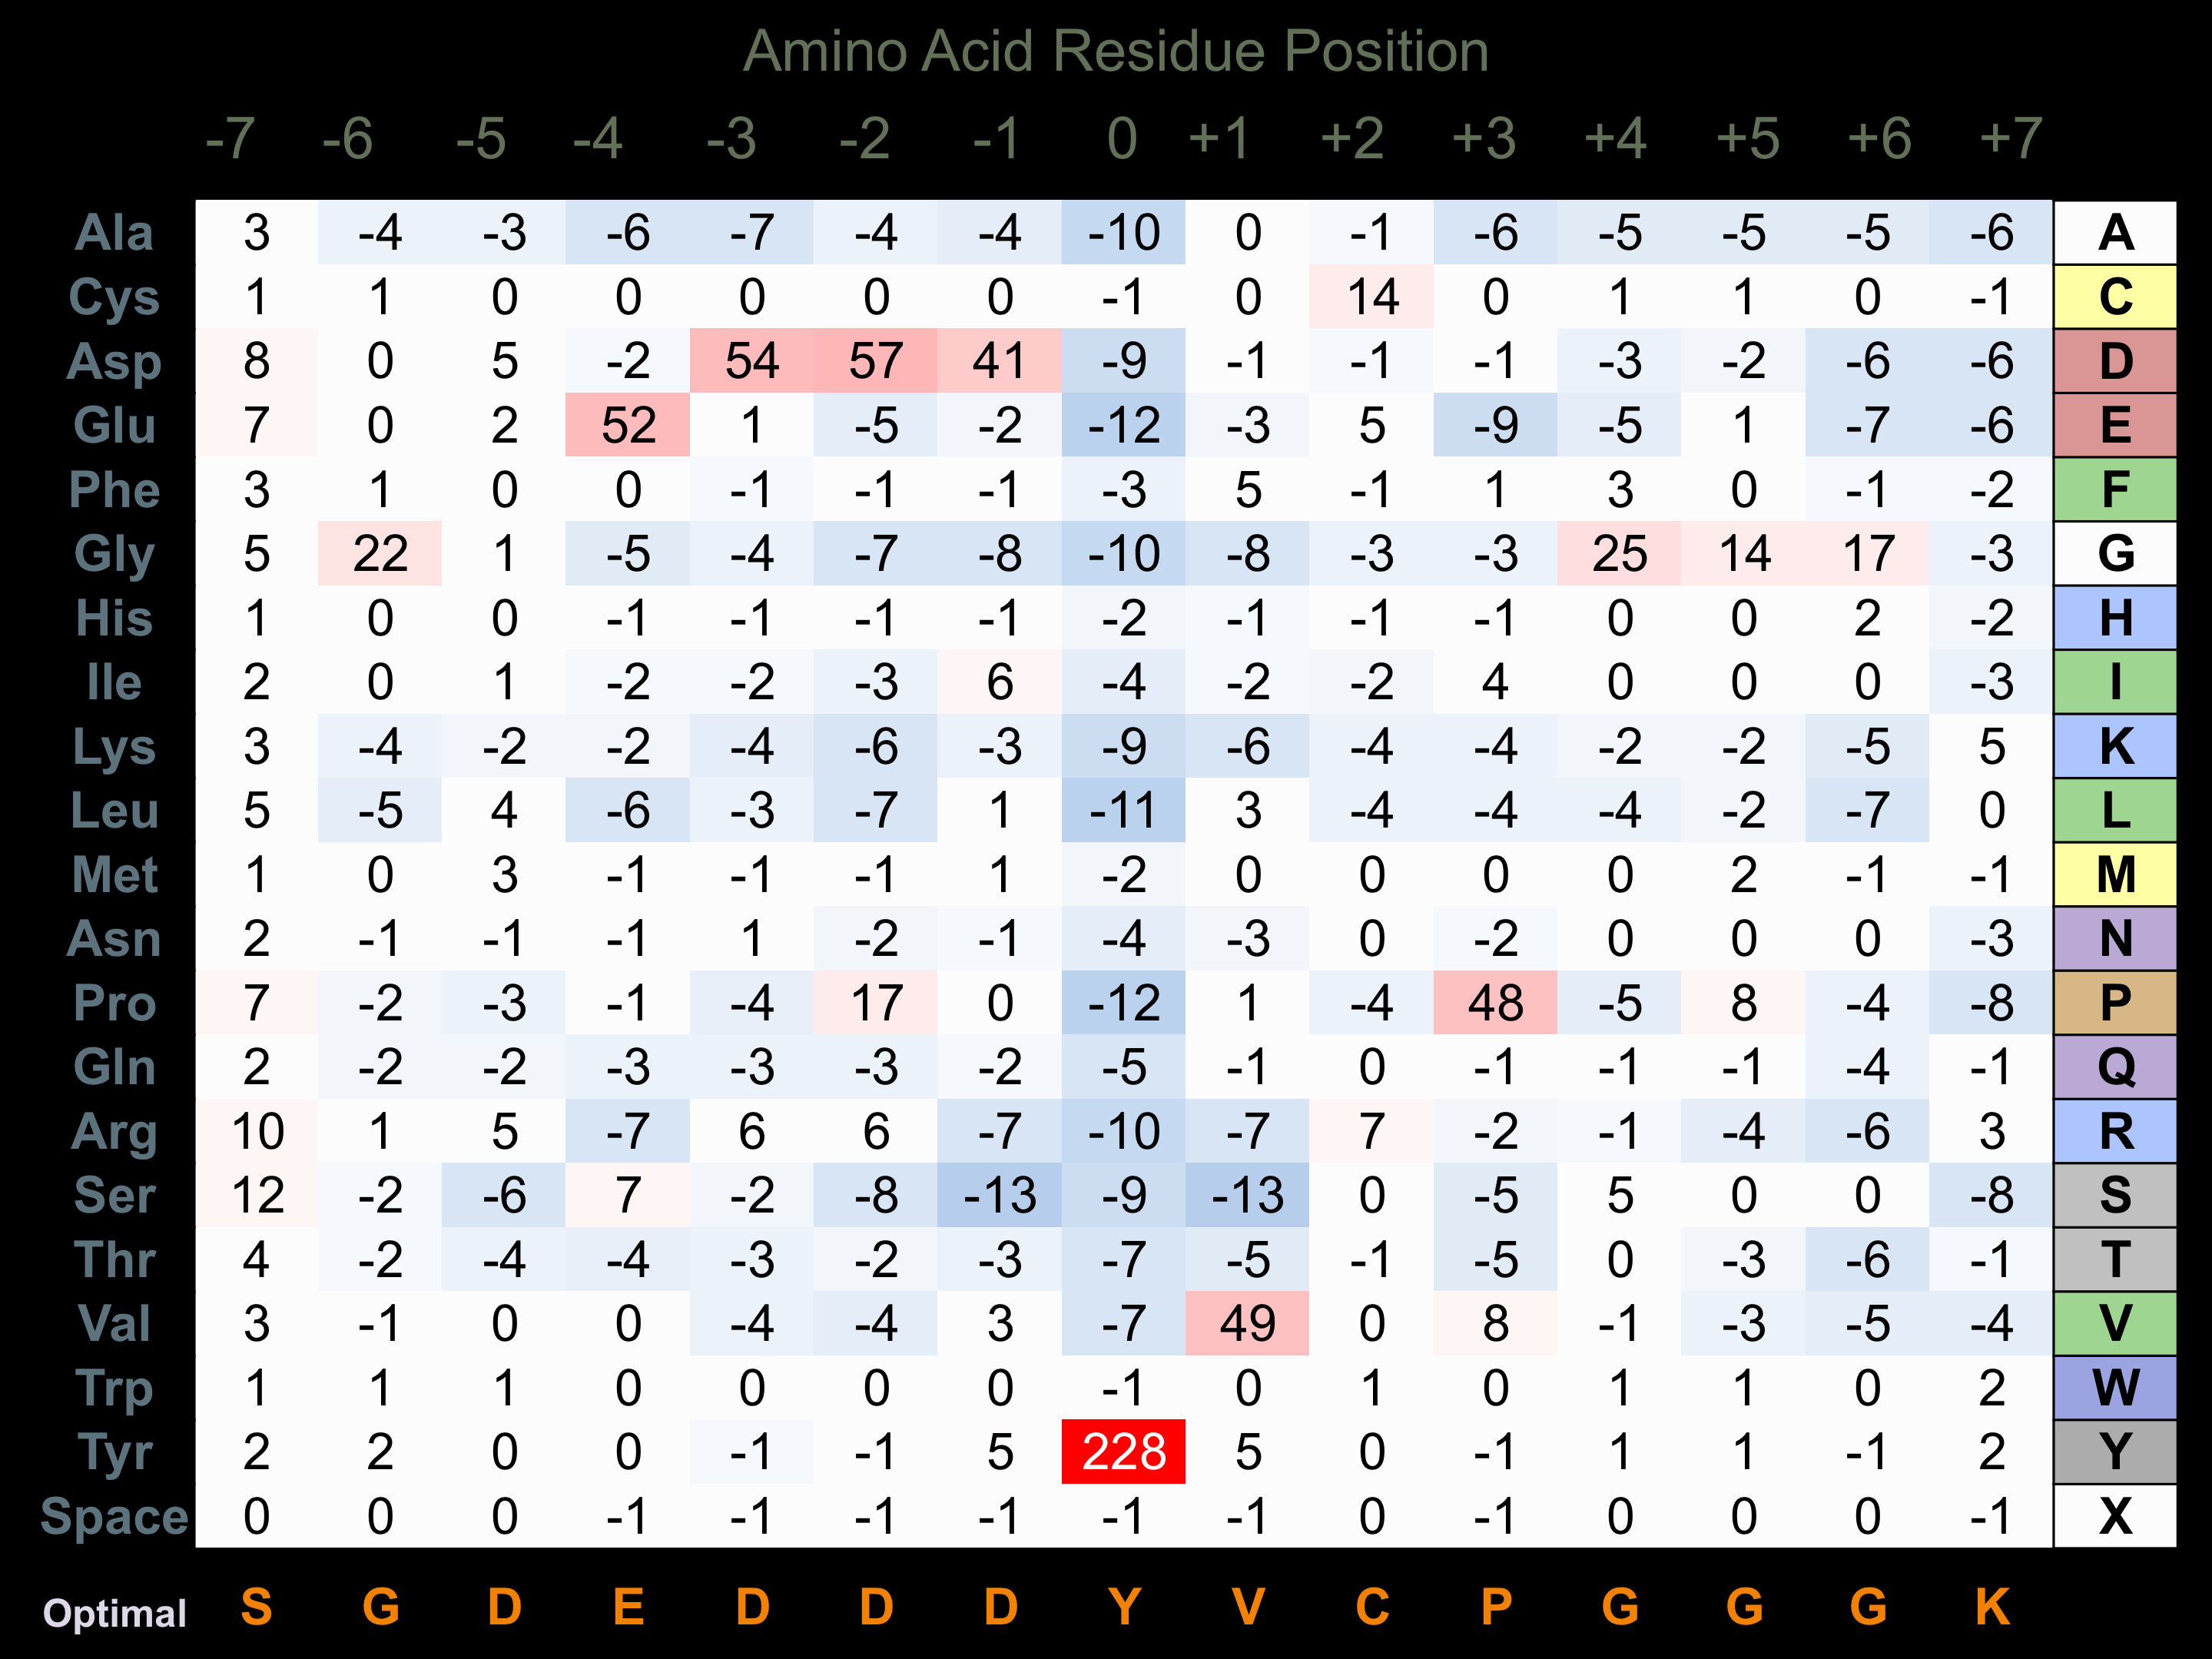
Matrix Type:
Predicted from the application of the Kinexus Kinase Substrate Predictor Version 2.0 algorithm, which was trained with over 10,000 kinase-protein substrate pairs and 8,000 kinase-peptide substrate pairs.
Domain #:
1
Inhibitors
For further details on these inhibitors click on the Compound Name and enter it into DrugKiNET or click on the ID's
Based on in vitro and/or in vivo phosphorylation data
| Compound Name | KD, Ki or IC50 (nM) | PubChem ID | ChEMBL ID | PubMed ID |
|---|
Disease Linkage
General Disease Association:
Cancer, genetic disorders
Specific Diseases (Non-cancerous):
Multiple cutaneous and mucosal venous malformations; Klippel-Trenaunay syndrome; Polycystic liver disease; Placenta accreta; Glomuvenous malformation
Comments:
Multiple cutaneous and mucosal venous malformations (VMCM) is an autosomal dominant disease characterized by malformation of blood vessels underlying areas of the skin and mucous membranes, resulting in the appearance of bluish venous lesions on the skin and mucous membranes (e.g. lining of the nasal and oral cavities). Mutations in the TIE2 gene have been observed in VMCM patients, including R849W, Y897S, L914F, A2690C, Y897C, and R915H substitution mutation. These mutations are predicted to result in a gain-of-function in the kinase catalytic activity of the TIE2 protein. Consequently, increased expression or activity of the TIE2 protein is suggested to play a role in the pathogenesis of this disease.
Specific Cancer Types:
Hemangiomas; Colorectal cancer; Cavernous hemangiomas; Capillary hemangiomas; Pyogenic granulomas; Tufted angiomas; Glomangioma; Intramuscular hemangiomas
Gene Expression in Cancers:
TranscriptoNET (www.transcriptonet.ca) analysis with mRNA expression data retrieved from the National Center for Biotechnology Information's Gene Expression Omnibus (GEO) database, which was normalized against 60 abundantly and commonly found proteins, indicated altered expression for this protein kinase as shown here as the percent change from normal tissue controls (%CFC) as supported with the Student T-test in the following types of human cancers: Bladder carcinomas (%CFC= -51, p<0.014); Lung adenocarcinomas (%CFC= -80, p<0.0001); Skin melanomas - malignant (%CFC= -81, p<0.009); and Vulvar intraepithelial neoplasia (%CFC= -45, p<0.062). The COSMIC website notes an up-regulated expression score for TIE2 in diverse human cancers of 284, which is 0.6-fold of the average score of 462 for the human protein kinases. The down-regulated expression score of 4 for this protein kinase in human cancers was 0.1-fold of the average score of 60 for the human protein kinases.
Mutagenesis Experiments:
Insertional mutagenesis studies in mice have not yet revealed a role for this protein kinase in mouse cancer oncogenesis.
Mutation Rate in All Cancers:
Percent mutation rates per 100 amino acids length in human cancers: 0.08 % in 25695 diverse cancer specimens. This rate is very similar (+ 7% higher) to the average rate of 0.075 % calculated for human protein kinases in general.
Mutation Rate in Specific Cancers:
Highest percent mutation rates per 100 amino acids length in human cancers: 0.6 % in 805 skin cancers tested; 0.32 % in 1178 large intestine cancers tested; 0.23 % in 589 stomach cancers tested; 0.21 % in 602 endometrium cancers tested; 0.07 % in 1941 lung cancers tested; 0.07 % in 1559 breast cancers tested; 0.06 % in 1963 central nervous system cancers tested.
Frequency of Mutated Sites:
None > 5 in 20,979 cancer specimens
Comments:
Only 5 deletions, 2 insertions and no complex mutations are noted on the COSMIC website.