
Nomenclature
Short Name:
MELK
Full Name:
Maternal embryonic leucine zipper kinase
Alias:
- EC 2.7.11.1
- KIAA0175
- PEg3 kinase
- PK38
- Protein kinase PK38
Classification
Type:
Protein-serine/threonine kinase
Group:
CAMK
Family:
CAMKL
SubFamily:
MELK

Specific Links
Structure
Mol. Mass (Da):
74,642
# Amino Acids:
651
# mRNA Isoforms:
8
mRNA Isoforms:
74,642 Da (651 AA; Q14680); 71,174 Da (619 AA; Q14680-6); 70,150 Da (610 AA; Q14680-7); 69,116 Da (603 AA; Q14680-8); 66,547 Da (580 AA; Q14680-5); 66,399 Da (580 AA; Q14680-2); 59,576 Da (520 AA; Q14680-4); 52,528 Da (457 AA; Q14680-3)
4D Structure:
Interacts with ZNF622 and PPP1R8.
1D Structure:
3D Image (rendered using PV Viewer):
PDB ID
Subfamily Alignment
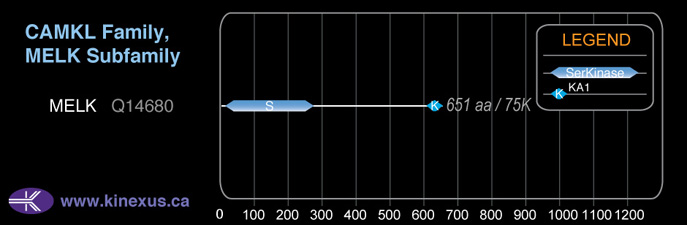
Domain Distribution:
Kinexus Products
Click on entries below for direct links to relevant products from Kinexus for this protein kinase.
hiddentext
Post-translation Modifications
For detailed information on phosphorylation of this kinase go to PhosphoNET
Methylated:
K639, K650.
Serine phosphorylated:
S171-, S236, S253, S335, S336, S338, S343, S356, S363, S391, S400, S405, S407, S431, S468, S486, S498, S505, S529, S544.
Threonine phosphorylated:
T56, T167+, T345, T348, T387, T398, T409, T415, T428, T446, T459, T460, T466, T478+, T489, T494, T518, T539, T542.
Tyrosine phosphorylated:
Y4, Y88, Y97, Y163, Y267, Y269, Y367, Y427, Y438.
Ubiquitinated:
K44, K55, K62, K134, K145, K395, K434, K481, K491, K536, K632, K650.
Distribution
Based on gene microarray analysis from the NCBI
Human Tissue Distribution
% Max Expression:
Mean Expression:
Number of Samples:
Standard Deviation:
% Max Expression:
Mean Expression:
Number of Samples:
Standard Deviation:
 33
33
1709
16
3243
 0.3
0.3
14
10
17
 1.1
1.1
55
18
98
 40
40
2020
66
5277
 7
7
336
14
360
 4
4
222
43
164
 6
6
309
19
475
 80
80
4102
42
8189
 10
10
499
10
451
 0.6
0.6
30
61
49
 0.7
0.7
35
31
49
 8
8
387
122
548
 0.8
0.8
39
29
46
 0.4
0.4
21
9
8
 0.6
0.6
30
27
68
 0.2
0.2
8
8
6
 0.4
0.4
20
116
27
 0.5
0.5
26
25
59
 0.3
0.3
15
60
23
 11
11
553
56
607
 0.5
0.5
24
27
39
 0.5
0.5
24
29
37
 1.2
1.2
59
27
48
 2
2
92
25
67
 3
3
173
27
166
 79
79
4058
46
9090
 2
2
109
32
74
 0.7
0.7
36
25
67
 0.7
0.7
36
25
59
 0.5
0.5
28
14
10
 10
10
529
18
388
 100
100
5109
21
9276
 30
30
1512
55
1550
 16
16
800
31
815
 3
3
137
22
96
Evolution
Species Conservation
PhosphoNET % Identity:
PhosphoNET % Similarity:
Homologene %
Identity:
PhosphoNET % Identity:
PhosphoNET % Similarity:
Homologene %
Identity:
 100
100
100
100 99.5
99.5
99.5
99.5 96.5
96.5
97.5
98 -
-
-
89.5 -
-
-
92 91.7
91.7
95.8
92 -
-
-
- 83.4
83.4
90.3
84 29.6
29.6
47.5
92 -
-
-
- 70.8
70.8
80.2
- 61.8
61.8
76
63 66.2
66.2
80.3
67 20.3
20.3
34.1
61 -
-
-
- -
-
-
- 39.9
39.9
55.8
- 38
38
56
43 32.8
32.8
45.5
- -
-
-
- -
-
-
- -
-
-
- 28.9
28.9
44.5
44.5 27
27
47.2
- -
-
-
-
For a wider analysis go to PhosphoNET Evolution in PhosphoNET
Binding Proteins
Examples of known interacting proteins
hiddentext
| No. | Name – UniProt ID |
|---|---|
| 1 | CDC25B - P30305 |
| 2 | ZNF622 - Q969S3 |
| 3 | BCL2L14 - Q9BZR8 |
| 4 | HIST1H1B - P16401 |
| 5 | CDC5L - Q99459 |
| 6 | SF3B1 - O75533 |
| 7 | PPP1R8 - Q12972 |
| 8 | EIF2S1 - P05198 |
| 9 | MBP - P02686 |
| 10 | LMNB1 - P20700 |
Regulation
Activation:
Phosphorylation at Thr-167, Ser-171 increases phosphotransferase activity. Phosphorylation at Thr-478 induces interaction with NIPP-1.
Inhibition:
NA
Synthesis:
NA
Degradation:
NA
Known Upstream Kinases
For further details on these substrates click on the Substrate Short Name or UniProt ID. Phosphosite Location is hyperlinked to PhosphoNET
predictions.
Based on in vitro and/or in vivo phosphorylation data
| Kinase Short Name | UniProt ID (Human) | Phosphosite Location | Phosphosite Sequence | Effect of Phosphorylation |
|---|
| MELK | Q14680 | T56 | SDLPRIKTEIEALKN | |
| MELK | Q14680 | Y163 | KPKGNKDYHLQTCCG | |
| MELK | Q14680 | T167 | NKDYHLQTCCGSLAY | + |
| LKB1 | Q15831 | T167 | NKDYHLQTCCGSLAY | + |
| MELK | Q14680 | S171 | HLQTCCGSLAYAAPE | - |
| MELK | Q14680 | S253 | VDPKKRISMKNLLNH | |
| MELK | Q14680 | S336 | PVRLRLSSFSCGQAS | |
| MELK | Q14680 | S343 | SFSCGQASATPFTDI | |
| MELK | Q14680 | S356 | DIKSNNWSLEDVTAS | |
| MELK | Q14680 | S391 | GAATPRTSQFTKYWT | |
| MELK | Q14680 | T398 | SQFTKYWTESNGVES | |
| MELK | Q14680 | S407 | SNGVESKSLTPALCR | |
| MELK | Q14680 | S431 | ENVYTPKSAVKNEEY | |
| MELK | Q14680 | T494 | TGTDKLMTGVISPER | |
| MELK | Q14680 | S505 | SPERRCRSVELDLNQ | |
| MELK | Q14680 | S529 | KGAKVFGSLERGLDK | |
| MELK | Q14680 | T539 | RGLDKVITVLTRSKR |
Known Downstream Substrates
For further details on these substrates click on the Substrate Short Name or UniProt ID. Phosphosite Location is hyperlinked to PhosphoNET
predictions.
Based on in vitro and/or in vivo phosphorylation data
| Substrate Short Name | UniProt ID (Human) | Phosphosite Location | Phosphosite Sequence | Effect of Phosphorylation |
|---|
| Cdc25B | P30305 | S169 | VLRNITNSQAPDGRR | |
| Cdc25B | P30305 | S323 | QRLFRSPSMPCSVIR | - |
| MELK | Q14680 | S171 | HLQTCCGSLAYAAPE | - |
| MELK | Q14680 | S253 | VDPKKRISMKNLLNH | |
| MELK | Q14680 | S336 | PVRLRLSSFSCGQAS | |
| MELK | Q14680 | S343 | SFSCGQASATPFTDI | |
| MELK | Q14680 | S356 | DIKSNNWSLEDVTAS | |
| MELK | Q14680 | S391 | GAATPRTSQFTKYWT | |
| MELK | Q14680 | S407 | SNGVESKSLTPALCR | |
| MELK | Q14680 | S431 | ENVYTPKSAVKNEEY | |
| MELK | Q14680 | S505 | SPERRCRSVELDLNQ | |
| MELK | Q14680 | S529 | KGAKVFGSLERGLDK | |
| MELK | Q14680 | T167 | NKDYHLQTCCGSLAY | + |
| MELK | Q14680 | T398 | SQFTKYWTESNGVES | |
| MELK | Q14680 | T494 | TGTDKLMTGVISPER | |
| MELK | Q14680 | T539 | RGLDKVITVLTRSKR | |
| MELK | Q14680 | T56 | SDLPRIKTEIEALKN | |
| MELK | Q14680 | Y163 | KPKGNKDYHLQTCCG |
Protein Kinase Specificity
Matrix of observed frequency (%) of amino acids in aligned protein substrate phosphosites
Matrix Type:
Predicted from the application of the Kinexus Kinase Substrate Predictor Version 2.0 algorithm, which was trained with over 10,000 kinase-protein substrate pairs and 8,000 kinase-peptide substrate pairs.
Domain #:
1
Inhibitors
For further details on these inhibitors click on the Compound Name and enter it into DrugKiNET or click on the ID's
Based on in vitro and/or in vivo phosphorylation data
| Compound Name | KD, Ki or IC50 (nM) | PubChem ID | ChEMBL ID | PubMed ID |
|---|
Disease Linkage
General Disease Association:
Cancer
Specific Cancer Types:
Brain cancer; Breast Cancer
Comments:
Defects in MELK are linked with some cancers including brain and breast cancers. Its expression is largely upregulated in aggressive undifferent tumours and associates with poor patient outcome. Therefore, it may play a role in tumour-initiating cells and regulation of cell proliferation. A possible mechanism involved in carcinogenesis is mediating inhibition of the pro-apoptotic function of BCL2L14.
Gene Expression in Cancers:
TranscriptoNET (www.transcriptonet.ca) analysis with mRNA expression data retrieved from the National Center for Biotechnology Information's Gene Expression Omnibus (GEO) database, which was normalized against 60 abundantly and commonly found proteins, indicated altered expression for this protein kinase as shown here as the percent change from normal tissue controls (%CFC) as supported with the Student T-test in the following types of human cancers: Barrett's esophagus epithelial metaplasia (%CFC= +68, p<0.01); Bladder carcinomas (%CFC= +119, p<0.005); Breast non-basal-like cancer (BLC) (%CFC= +139, p<0.0001); Breast sporadic basal-like cancer (BLC) (%CFC= +166, p<0.0001); Cervical cancer (%CFC= -78, p<0.0001); Classical Hodgkin lymphomas (%CFC= +282, p<0.0004); Colon mucosal cell adenomas (%CFC= +177, p<0.0001); Gastric cancer (%CFC= +87, p<(0.0003); Large B-cell lymphomas (%CFC= +227, p<0.0002); Malignant pleural mesotheliomas (MPM) tumours (%CFC= +54, p<0.032); Oral squamous cell carcinomas (OSCC) (%CFC= +276, p<(0.0003); Ovary adenocarcinomas (%CFC= +1137, p<0.019); Skin melanomas - malignant (%CFC= +112, p<0.0001); Skin squamous cell carcinomas (%CFC= +252, p<0.068); and Vulvar intraepithelial neoplasia (%CFC= +533, p<0.0001). The COSMIC website notes an up-regulated expression score for MELK in diverse human cancers of 630, which is 1.4-fold of the average score of 462 for the human protein kinases. The down-regulated expression score of 13 for this protein kinase in human cancers was 0.2-fold of the average score of 60 for the human protein kinases.
Mutagenesis Experiments:
Insertional mutagenesis studies in mice have not yet revealed a role for this protein kinase in mouse cancer oncogenesis.
Mutation Rate in All Cancers:
Percent mutation rates per 100 amino acids length in human cancers: 0.07 % in 24846 diverse cancer specimens. This rate is only -3 % lower and is very similar to the average rate of 0.075 % calculated for human protein kinases in general.
Mutation Rate in Specific Cancers:
Highest percent mutation rates per 100 amino acids length in human cancers: 0.55 % in 1093 large intestine cancers tested.
Frequency of Mutated Sites:
None > 6 in 20,010 cancer specimens
Comments:
Only 4 deletions, no insertions or complex mutations are noted on the COSMIC website.