
Nomenclature
Short Name:
HRI
Full Name:
Eukaryotic translation initiation factor 2 alpha kinase 1
Alias:
- E2AK1
- Hemin-sensitive initiation factor-2 alpha kinase
- EC 2.7.11.1
- EIF2AK1
- HCR
- Heme-controlled repressor;heme-regulated inhibitor
Classification
Type:
Protein-serine/threonine kinase
Group:
Other
Family:
PEK
SubFamily:
NA

Structure
Mol. Mass (Da):
71,106
# Amino Acids:
630
# mRNA Isoforms:
2
mRNA Isoforms:
71,106 Da (630 AA; Q9BQI3); 71,035 Da (629 AA; Q9BQI3-2)
4D Structure:
Synthesized in an inactive form that binds to the N-terminal domain of CDC37. Has to be associated with a multiprotein complex containing Hsp90, CDC37 and PPP5C for maturation and activation by autophosphorylation. The phosphatase PPP5C modulates this activation. Homodimer; non-covalently bound in the absence of hemin. Converted to an inactive disulfide linked homodimer in the presence of hemin
1D Structure:
Subfamily Alignment
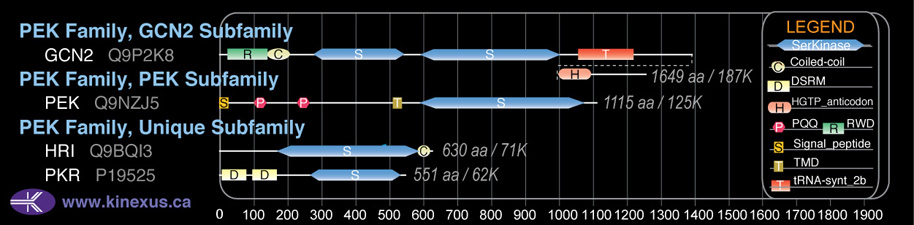
Domain Distribution:
| Start | End | Domain |
|---|---|---|
| 167 | 583 | Pkinase |
| 588 | 620 | Coiled-coil |
Kinexus Products
Click on entries below for direct links to relevant products from Kinexus for this protein kinase.
hiddentext
Post-translation Modifications
For detailed information on phosphorylation of this kinase go to PhosphoNET
Serine phosphorylated:
S6+, S258, S274, S275, S276, S277, S278, S295, S498.
Threonine phosphorylated:
T285, T297, T486, T488+, .
Ubiquitinated:
K175, K303.
Distribution
Based on gene microarray analysis from the NCBI
Human Tissue Distribution
% Max Expression:
Mean Expression:
Number of Samples:
Standard Deviation:
% Max Expression:
Mean Expression:
Number of Samples:
Standard Deviation:
 20
20
1099
29
964
 6
6
315
15
290
 6
6
314
16
212
 17
17
922
105
1143
 18
18
992
25
730
 12
12
653
81
1637
 8
8
430
31
406
 23
23
1268
53
2139
 14
14
747
17
586
 6
6
327
89
322
 6
6
345
36
326
 15
15
842
158
738
 6
6
301
38
244
 2
2
136
12
133
 5
5
279
31
243
 7
7
387
15
406
 9
9
498
129
3060
 9
9
509
25
412
 5
5
274
91
256
 13
13
733
109
685
 8
8
441
29
385
 5
5
255
33
222
 10
10
529
18
404
 4
4
231
25
184
 6
6
338
29
298
 26
26
1421
69
1596
 7
7
375
41
298
 6
6
319
25
229
 5
5
286
25
215
 100
100
5443
28
5599
 18
18
975
24
725
 13
13
706
36
745
 4
4
244
65
434
 22
22
1174
52
846
 11
11
604
35
765
Evolution
Species Conservation
PhosphoNET % Identity:
PhosphoNET % Similarity:
Homologene %
Identity:
PhosphoNET % Identity:
PhosphoNET % Similarity:
Homologene %
Identity:
 100
100
100
100 95.4
95.4
96.3
99 94.8
94.8
97
95 -
-
-
81.5 -
-
-
85 -
-
-
84 -
-
-
- 81.6
81.6
89.2
83 81
81
88.6
82 -
-
-
- 63.8
63.8
76
- 53.2
53.2
67.4
56 -
-
-
51 42.4
42.4
58.1
49 -
-
-
- -
-
-
- 21.1
21.1
37
- -
-
-
- -
-
-
- -
-
-
- -
-
-
- -
-
-
- -
-
-
- -
-
-
- -
-
-
-
For a wider analysis go to PhosphoNET Evolution in PhosphoNET
Binding Proteins
Examples of known interacting proteins
hiddentext
| No. | Name – UniProt ID |
|---|---|
| 1 | EIF2S1 - P05198 |
| 2 | HSPA1A - P08107 |
| 3 | CDC37 - Q16543 |
| 4 | HSP90AA1 - P07900 |
| 5 | HSP90AA2 - Q14568 |
| 6 | TGFBR1 - P36897 |
Regulation
Activation:
Binding of nitric oxide (NO) to the heme iron in the N-terminal heme-binding domain activates the kinase activity.
Inhibition:
Hemin inactivates EIF2AK1 by promoting the formation of a disulfide-linked homodimer. ; binding of carbon monoxide (CO) suppresses kinase activity
Synthesis:
NA
Degradation:
NA
Known Upstream Kinases
For further details on these substrates click on the Substrate Short Name or UniProt ID. Phosphosite Location is hyperlinked to PhosphoNET
predictions.
Based on in vitro and/or in vivo phosphorylation data
| Kinase Short Name | UniProt ID (Human) | Phosphosite Location | Phosphosite Sequence | Effect of Phosphorylation |
|---|
Known Downstream Substrates
For further details on these substrates click on the Substrate Short Name or UniProt ID. Phosphosite Location is hyperlinked to PhosphoNET
predictions.
Based on in vitro and/or in vivo phosphorylation data
| Substrate Short Name | UniProt ID (Human) | Phosphosite Location | Phosphosite Sequence | Effect of Phosphorylation |
|---|
Protein Kinase Specificity
Matrix of observed frequency (%) of amino acids in aligned protein substrate phosphosites
Matrix Type:
Predicted from the application of the Kinexus Kinase Substrate Predictor Version 2.0 algorithm, which was trained with over 10,000 kinase-protein substrate pairs and 8,000 kinase-peptide substrate pairs. Note that HRI has a strong preference for phosphorylation of eIF2A due to additional binding sites for this substrate. This additional selectivity in binding eIF2A appear to arise from the Gap 3 and Gap 4 insert regions in the catalytic domain of the protein kinase between Subdomains IV and VI.
Domain #:
1
Inhibitors
For further details on these inhibitors click on the Compound Name and enter it into DrugKiNET or click on the ID's
Based on in vitro and/or in vivo phosphorylation data
| Compound Name | KD, Ki or IC50 (nM) | PubChem ID | ChEMBL ID | PubMed ID |
|---|
| Bosutinib | Kd = 630 nM | 5328940 | 288441 | 22037378 |
| Alvocidib | Kd = 870 nM | 9910986 | 428690 | 22037378 |
| Foretinib | Kd = 980 nM | 42642645 | 1230609 | 22037378 |
| TG101348 | Kd = 1 µM | 16722836 | 1287853 | 22037378 |
| WZ3146 | Kd > 1 µM | 44607360 | 20033049 | |
| WZ4002 | Kd > 1 µM | 44607530 | 20033049 | |
| Barasertib | Kd = 1.5 µM | 16007391 | 215152 | 22037378 |
| Cediranib | Kd = 3.1 µM | 9933475 | 491473 | 22037378 |
Disease Linkage
General Disease Association:
Cancer
Specific Cancer Types:
Ovarian cancer
Comments:
HRI was found to be down-regulated in the majority of ovarian cancers. However, in general in human cancers, it is up-regulated about 2.4-times the rate observed for most protein kinases.
Gene Expression in Cancers:
TranscriptoNET (www.transcriptonet.ca) analysis with mRNA expression data retrieved from the National Center for Biotechnology Information's Gene Expression Omnibus (GEO) database, which was normalized against 60 abundantly and commonly found proteins, indicated altered expression for this protein kinase as shown here as the percent change from normal tissue controls (%CFC) as supported with the Student T-test in the following types of human cancers: Bladder carcinomas (%CFC= +126, p<0.002); Large B-cell lymphomas (%CFC= +60, p<0.037); Malignant pleural mesotheliomas (MPM) tumours (%CFC= +172, p<0.0002); and Skin melanomas - malignant (%CFC= +157, p<0.0002). The COSMIC website notes an up-regulated expression score for HRI in diverse human cancers of 1125, which is 2.4-fold of the average score of 462 for the human protein kinases. The down-regulated expression score of 106 for this protein kinase in human cancers was 1.8-fold of the average score of 60 for the human protein kinases.
Mutagenesis Experiments:
Insertional mutagenesis studies in mice have not yet revealed a role for this protein kinase in mouse cancer oncogenesis.
Mutation Rate in All Cancers:
Percent mutation rates per 100 amino acids length in human cancers: 0.09 % in 24922 diverse cancer specimens. This rate is only 16 % higher than the average rate of 0.075 % calculated for human protein kinases in general.
Mutation Rate in Specific Cancers:
Highest percent mutation rates per 100 amino acids length in human cancers: 0.37 % in 1270 large intestine cancers tested; 0.3 % in 589 stomach cancers tested; 0.29 % in 864 skin cancers tested; 0.24 % in 603 endometrium cancers tested; 0.2 % in 548 urinary tract cancers tested; 0.17 % in 273 cervix cancers tested; 0.16 % in 710 oesophagus cancers tested; 0.15 % in 1685 lung cancers tested; 0.07 % in 238 bone cancers tested; 0.07 % in 1316 breast cancers tested; 0.07 % in 1078 upper aerodigestive tract cancers tested; 0.06 % in 1512 liver cancers tested; 0.05 % in 1276 kidney cancers tested; 0.04 % in 881 prostate cancers tested; 0.04 % in 1459 pancreas cancers tested; 0.03 % in 558 thyroid cancers tested; 0.02 % in 833 ovary cancers tested; 0.02 % in 2082 central nervous system cancers tested; 0.01 % in 2009 haematopoietic and lymphoid cancers tested.
Frequency of Mutated Sites:
Most frequent mutations with the number of reports indicated in brackets: S278F (3).
Comments:
Nine deletions (8 at I198fs*2), 2 insertions and 1 complex mutation are noted on the COSMIC website.