
Nomenclature
Short Name:
ChaK2
Full Name:
Transient receptor potential cation channel subfamily M member 6
Alias:
- CHAK2
- EC 2.7.11.1
- Transient receptor potential cation channel, subfamily M, member 6
- TRPM6
- FLJ22628
- HOMG
- HSH
- LTRPC6 channel kinase 2
Classification
Type:
Protein-serine/threonine kinase
Group:
Atypical
Family:
Alpha
SubFamily:
ChaK

Structure
Mol. Mass (Da):
231,708
# Amino Acids:
2022
# mRNA Isoforms:
7
mRNA Isoforms:
231,708 Da (2022 AA; Q9BX84); 231,041 Da (2017 AA; Q9BX84-2); 230,956 Da (2017 AA; Q9BX84-3); 223,124 Da (1943 AA; Q9BX84-4); 111,301 Da (973 AA; Q9BX84-5); 97,520 Da (855 AA; Q9BX84-6); 65,083 Da (569 AA; Q9BX84-7)
4D Structure:
Forms heterodimers with TRPM7. TRPM6 requires the presence of TRPM7 to be targeted to the cell membrane (in HEK 293 cells).
1D Structure:
Subfamily Alignment
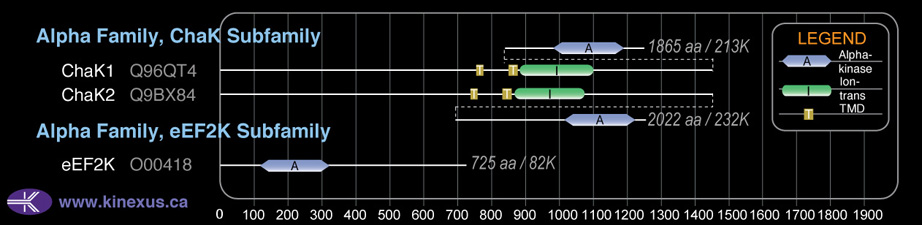
Domain Distribution:
| Start | End | Domain |
|---|---|---|
| 742 | 762 | TMD |
| 842 | 862 | TMD |
| 863 | 1068 | Ion_trans |
| 1750 | 1980 | Alpha_kinase |
Post-translation Modifications
For detailed information on phosphorylation of this kinase go to PhosphoNET
Acetylated:
K1144, K1145.
Methylated:
K14.
Serine phosphorylated:
S78, S743, S1000, S1244, S1563, S1747, S1756.
Threonine phosphorylated:
T150, T509, T1245, T1304, T1430, T1435, T1851-.
Tyrosine phosphorylated:
Y519, Y782, Y783, Y800, Y832.
Ubiquitinated:
K85.
Distribution
Based on gene microarray analysis from the NCBI
Human Tissue Distribution
% Max Expression:
Mean Expression:
Number of Samples:
Standard Deviation:
% Max Expression:
Mean Expression:
Number of Samples:
Standard Deviation:
 100
100
1241
31
1110
 27
27
339
18
822
 2
2
25
15
16
 13
13
166
129
501
 24
24
299
47
234
 0.6
0.6
8
64
7
 25
25
308
48
436
 32
32
403
35
785
 24
24
299
13
384
 11
11
141
110
659
 18
18
219
31
747
 60
60
742
100
631
 8
8
99
31
306
 49
49
606
13
1293
 15
15
187
29
618
 9
9
116
26
359
 8
8
94
45
317
 15
15
182
28
477
 13
13
167
113
753
 31
31
381
147
577
 21
21
260
28
652
 0.9
0.9
11
26
13
 0.7
0.7
9
16
10
 42
42
516
32
1130
 10
10
120
28
300
 40
40
494
91
557
 7
7
91
36
294
 18
18
218
28
624
 14
14
178
27
511
 11
11
136
56
80
 43
43
530
18
381
 81
81
1007
40
2255
 27
27
330
116
854
 57
57
709
104
620
 8
8
94
61
64
Evolution
Species Conservation
PhosphoNET % Identity:
PhosphoNET % Similarity:
Homologene %
Identity:
PhosphoNET % Identity:
PhosphoNET % Similarity:
Homologene %
Identity:
 100
100
100
100 99.3
99.3
99.5
100 91.6
91.6
93.1
96 -
-
-
85 -
-
-
- 85.3
85.3
90.9
86 -
-
-
- 78.1
78.1
85.4
79 52.5
52.5
66.7
78 -
-
-
- -
-
-
- 53.3
53.3
67.5
69 -
-
-
67 52.1
52.1
65.7
- -
-
-
- 31.8
31.8
50.6
- -
-
-
- -
-
-
- -
-
-
- -
-
-
- -
-
-
- -
-
-
- -
-
-
- -
-
-
- -
-
-
-
For a wider analysis go to PhosphoNET Evolution in PhosphoNET
Binding Proteins
Examples of known interacting proteins
hiddentext
| No. | Name – UniProt ID |
|---|---|
| 1 | TRPM7 - Q96QT4 |
| 2 | MYH9 - P35579 |
| 3 | MYH10 - P35580 |
Regulation
Activation:
NA
Inhibition:
Inhibited by phosphorylation at T1857.
Synthesis:
NA
Degradation:
NA
Known Upstream Kinases
For further details on these substrates click on the Substrate Short Name or UniProt ID. Phosphosite Location is hyperlinked to PhosphoNET
predictions.
Based on in vitro and/or in vivo phosphorylation data
| Kinase Short Name | UniProt ID (Human) | Phosphosite Location | Phosphosite Sequence | Effect of Phosphorylation |
|---|
Known Downstream Substrates
For further details on these substrates click on the Substrate Short Name or UniProt ID. Phosphosite Location is hyperlinked to PhosphoNET
predictions.
Based on in vitro and/or in vivo phosphorylation data
| Substrate Short Name | UniProt ID (Human) | Phosphosite Location | Phosphosite Sequence | Effect of Phosphorylation |
|---|
Inhibitors
For further details on these inhibitors click on the Compound Name and enter it into DrugKiNET or click on the ID's
Based on in vitro and/or in vivo phosphorylation data
| Compound Name | KD, Ki or IC50 (nM) | PubChem ID | ChEMBL ID | PubMed ID |
|---|
Disease Linkage
General Disease Association:
Metabolic disorders
Specific Diseases (Non-cancerous):
Hypomagnesemia with secondary hypocalcemia; Hypomagnesemia 1, intestinal
Comments:
Hypomagnesia with secondary hypocalcemia (HSH) is a genetic disease characterized by decreased intestinal magnesium absorption. Reduced serum magnesium levels are thought to result in decreased production of parathryoid hormone (PH) by the parathyroid gland, which leads to reduced serum calcium levels, thus causing secondary hypocalcemia. HSH is characterized by low serum levels of Mg2+ due to defects in intestinal Mg2+ absorption and/or excessive expulsion of Mg2+ at the kidneys. Autosomal recessive HRH is caused by mutations in the TRPM6 gene. TRPM6 is an ion channel and serine/threonine kinase that is crucial for magnesium homeostasis. TRPM6 functions in the active epithelial tranport of magnesium in the intestine and kidney, thus serving a critical role in the absorption of dietary magnesium. Therefore, loss-of-function mutations in the TRPM6 gene that result in defective magnesium transport are thought to be key conrtibutors to the development of HSH. Several mutations of the TRPM6 gene have been identified in patients with HSH including a S590X nonsense mutation, a splice site mutation causing exon skipping, frameshift mutations resulting in truncation of the TRPM6 protein, a R484X nonsense mutation, a R56X nonsense mutation, and a S141L mutation. To form functional ion channels at the cellular membrane, TRPM6 proteins oligomerize with TRMP7 proteins to form a protein complex at the cell surface. The observed S141L mutation prevents the oligomerization of TRPM6 and TRPM7 proteins, thus preventing the formation of functional ion channels and inhibiting magnesium absorption, thus leading to the HSH phenotype.
Gene Expression in Cancers:
TranscriptoNET (www.transcriptonet.ca) analysis with mRNA expression data retrieved from the National Center for Biotechnology Information's Gene Expression Omnibus (GEO) database, which was normalized against 60 abundantly and commonly found proteins, indicated altered expression for this protein kinase as shown here as the percent change from normal tissue controls (%CFC) as supported with the Student T-test in the following types of human cancers: Bladder carcinomas (%CFC= -60, p<0.0008); and Colon mucosal cell adenomas (%CFC= -95, p<0.0001). The COSMIC website notes an up-regulated expression score for ChaK2 in diverse human cancers of 370, which is 0.8-fold of the average score of 462 for the human protein kinases. The down-regulated expression score of 0 for this protein kinase in human cancers was 100% lower than the average score of 60 for the human protein kinases.
Mutagenesis Experiments:
Insertional mutagenesis studies in mice have not yet revealed a role for this protein kinase in mouse cancer oncogenesis.
Mutation Rate in All Cancers:
Percent mutation rates per 100 amino acids length in human cancers: 0.1 % in 24727 diverse cancer specimens. This rate is only 29 % higher than the average rate of 0.075 % calculated for human protein kinases in general.
Mutation Rate in Specific Cancers:
Highest percent mutation rates per 100 amino acids length in human cancers: 0.55 % in 864 skin cancers tested; 0.27 % in 1270 large intestine cancers tested; 0.24 % in 589 stomach cancers tested; 0.22 % in 603 endometrium cancers tested; 0.22 % in 1635 lung cancers tested; 0.13 % in 273 cervix cancers tested; 0.12 % in 1512 liver cancers tested; 0.1 % in 548 urinary tract cancers tested; 0.09 % in 710 oesophagus cancers tested; 0.08 % in 942 upper aerodigestive tract cancers tested; 0.08 % in 881 prostate cancers tested; 0.08 % in 1276 kidney cancers tested; 0.06 % in 238 bone cancers tested; 0.06 % in 1316 breast cancers tested.
Frequency of Mutated Sites:
Most frequent mutations with the number of reports indicated in brackets: V875F (11); E1150G (3).
Comments:
Only 3 deletions, no insertions or complex mutations.