
Nomenclature
Short Name:
SGK2
Full Name:
Serine-threonine-protein kinase Sgk2
Alias:
- EC 2.7.11.1
- Sgk2
Classification
Type:
Protein-serine/threonine kinase
Group:
AGC
Family:
SGK
SubFamily:
NA

Structure
Mol. Mass (Da):
47,604
# Amino Acids:
427
# mRNA Isoforms:
3
mRNA Isoforms:
47,604 Da (427 AA; Q9HBY8); 43,977 Da (393 AA; Q9HBY8-3); 41,175 Da (367 AA; Q9HBY8-2)
4D Structure:
NA
1D Structure:
Subfamily Alignment
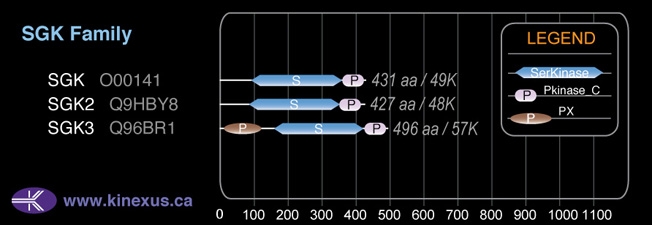
Domain Distribution:
Kinexus Products
Click on entries below for direct links to relevant products from Kinexus for this protein kinase.
hiddentext
Post-translation Modifications
For detailed information on phosphorylation of this kinase go to PhosphoNET
Serine phosphorylated:
S252+.
Threonine phosphorylated:
T251, T253+.
Tyrosine phosphorylated:
Y285.
Ubiquitinated:
K124.
Distribution
Based on gene microarray analysis from the NCBI
Human Tissue Distribution
% Max Expression:
Mean Expression:
Number of Samples:
Standard Deviation:
% Max Expression:
Mean Expression:
Number of Samples:
Standard Deviation:
 45
45
1083
22
986
 2
2
60
9
75
 5
5
129
13
240
 9
9
207
85
402
 19
19
469
21
313
 2
2
44
46
36
 8
8
202
25
83
 54
54
1302
34
2775
 33
33
796
10
685
 10
10
248
71
218
 8
8
202
26
201
 24
24
576
94
585
 3
3
66
24
138
 2
2
60
6
59
 6
6
143
11
85
 0.9
0.9
22
12
30
 2
2
41
92
126
 6
6
154
18
314
 2
2
60
67
54
 20
20
481
84
380
 6
6
154
22
142
 2
2
51
24
120
 6
6
147
14
181
 2
2
56
18
103
 3
3
84
22
193
 33
33
804
57
1574
 2
2
54
27
116
 5
5
110
18
216
 3
3
80
18
130
 4
4
97
28
84
 19
19
451
30
208
 100
100
2423
26
4127
 2
2
60
62
185
 32
32
782
52
693
 0.8
0.8
19
53
24
Evolution
Species Conservation
PhosphoNET % Identity:
PhosphoNET % Similarity:
Homologene %
Identity:
PhosphoNET % Identity:
PhosphoNET % Similarity:
Homologene %
Identity:
 100
100
100
100 85.9
85.9
87.8
99 83.6
83.6
86.2
98 -
-
-
96 -
-
-
- 62.4
62.4
75.9
93 -
-
-
- 81
81
83.6
94 80.6
80.6
83.4
94 -
-
-
- 73.7
73.7
80.9
- 62
62
75.5
83 60.4
60.4
74.9
83 63.5
63.5
74.4
75 -
-
-
- 33.9
33.9
45.3
- -
-
-
- 41.9
41.9
58.5
- -
-
-
- -
-
-
- -
-
-
- -
-
-
49 -
-
-
- 30.4
30.4
40.3
54 -
-
-
53
For a wider analysis go to PhosphoNET Evolution in PhosphoNET
Regulation
Activation:
Two specific sites, one in the kinase domain (Thr-253) and the other in the C-terminal regulatory region (Ser-416), need to be phosphorylated for its full activation.
Inhibition:
NA
Synthesis:
NA
Degradation:
NA
Known Upstream Kinases
For further details on these substrates click on the Substrate Short Name or UniProt ID. Phosphosite Location is hyperlinked to PhosphoNET
predictions.
Based on in vitro and/or in vivo phosphorylation data
| Kinase Short Name | UniProt ID (Human) | Phosphosite Location | Phosphosite Sequence | Effect of Phosphorylation |
|---|
Protein Kinase Specificity
Matrix of observed frequency (%) of amino acids in aligned protein substrate phosphosites
Matrix Type:
Predicted from the application of the Kinexus Kinase Substrate Predictor Version 2.0 algorithm, which was trained with over 10,000 kinase-protein substrate pairs and 8,000 kinase-peptide substrate pairs.
Domain #:
1
Inhibitors
For further details on these inhibitors click on the Compound Name and enter it into DrugKiNET or click on the ID's
Based on in vitro and/or in vivo phosphorylation data
| Compound Name | KD, Ki or IC50 (nM) | PubChem ID | ChEMBL ID | PubMed ID |
|---|
| K-252a; Nocardiopsis sp. | IC50 > 50 nM | 3813 | 281948 | 22037377 |
| Staurosporine | IC50 > 50 nM | 5279 | 22037377 | |
| AT9283 | IC50 > 100 nM | 24905142 | 19143567 | |
| JAK3 Inhibitor VI | IC50 > 150 nM | 16760524 | 22037377 | |
| PKR Inhibitor | IC50 > 150 nM | 6490494 | 235641 | 22037377 |
| SB218078 | IC50 > 150 nM | 447446 | 289422 | 22037377 |
| Cdk1/2 Inhibitor III | IC50 > 250 nM | 5330812 | 261720 | 22037377 |
| A 443654 | IC50 < 1 µM | 10172943 | 379300 | 19465931 |
| ALX-270-403-M001 | IC50 > 1 µM | 22037377 | ||
| MK5108 | IC50 > 1 µM | 24748204 | 20053775 | |
| Pyrimidylpyrrole, 11e | Ki = 1 µM | 11634725 | 583042 | 19827834 |
| Silmitasertib | IC50 > 1 µM | 24748573 | 21174434 | |
| SNS314 | IC50 > 1 µM | 16047143 | 514582 | 18678489 |
| SU11652 | IC50 > 1 µM | 24906267 | 13485 | 22037377 |
| TBCA | IC50 > 1 µM | 1095828 | 22037377 | |
| SureCN2579964 | IC50 < 2 µM | 290221 | 233000 | 22934575 |
| JNJ-28871063 | IC50 > 4 µM | 17747413 | 17975007 |
Disease Linkage
Gene Expression in Cancers:
TranscriptoNET (www.transcriptonet.ca) analysis with mRNA expression data retrieved from the National Center for Biotechnology Information's Gene Expression Omnibus (GEO) database, which was normalized against 60 abundantly and commonly found proteins, indicated altered expression for this protein kinase as shown here as the percent change from normal tissue controls (%CFC) as supported with the Student T-test in the following types of human cancers: Barrett's esophagus epithelial metaplasia (%CFC= +93, p<0.019); Breast epithelial carcinomas (%CFC= -52, p<0.035); Clear cell renal cell carcinomas (cRCC) (%CFC= -54, p<0.019); Colon mucosal cell adenomas (%CFC= -49, p<0.0001); Ovary adenocarcinomas (%CFC= +85, p<0.014); Prostate cancer - metastatic (%CFC= +696, p<0.001); Skin squamous cell carcinomas (%CFC= -64, p<0.049); and Vulvar intraepithelial neoplasia (%CFC= -79, p<0.0001). The COSMIC website notes an up-regulated expression score for SGK2 in diverse human cancers of 534, which is 1.2-fold of the average score of 462 for the human protein kinases. The down-regulated expression score of 7 for this protein kinase in human cancers was 0.1-fold of the average score of 60 for the human protein kinases.
Mutagenesis Experiments:
Insertional mutagenesis studies in mice have not yet revealed a role for this protein kinase in mouse cancer oncogenesis.
Mutation Rate in All Cancers:
Percent mutation rates per 100 amino acids length in human cancers: 0.09 % in 25383 diverse cancer specimens. This rate is only 17 % higher than the average rate of 0.075 % calculated for human protein kinases in general.
Mutation Rate in Specific Cancers:
Highest percent mutation rates per 100 amino acids length in human cancers: 0.52 % in 864 skin cancers tested; 0.3 % in 1270 large intestine cancers tested; 0.29 % in 575 stomach cancers tested; 0.18 % in 127 biliary tract cancers tested; 0.16 % in 603 endometrium cancers tested; 0.15 % in 2007 lung cancers tested; 0.13 % in 548 urinary tract cancers tested; 0.13 % in 1490 breast cancers tested; 0.11 % in 1512 liver cancers tested; 0.1 % in 710 oesophagus cancers tested; 0.1 % in 238 bone cancers tested; 0.07 % in 942 upper aerodigestive tract cancers tested; 0.07 % in 1276 kidney cancers tested; 0.05 % in 891 ovary cancers tested.
Frequency of Mutated Sites:
None > 3 in 20,666 cancer specimens
Comments:
Only 1 deletion and 1 insertion, and no complex mutations are noted on the COSMIC website.