
Nomenclature
Short Name:
CK1g1
Full Name:
Casein kinase I, gamma 1 isoform
Alias:
- CK1-gamma1
- CSNK1G1
- EC 2.7.11.1
- KC11
- KC1G1
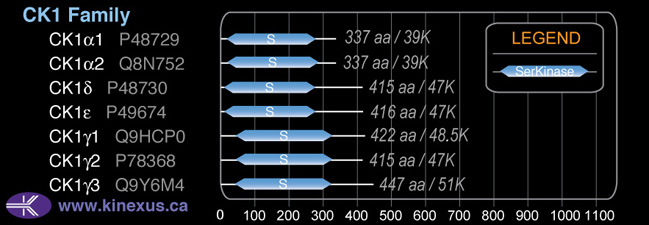
Classification
Type:
Protein-serine/threonine kinase
Group:
CK1
Family:
CK1
SubFamily:
NA

Structure
Mol. Mass (Da):
48,511
# Amino Acids:
422
# mRNA Isoforms:
2
mRNA Isoforms:
48,511 Da (422 AA; Q9HCP0); 45,414 Da (393 AA; Q9HCP0-2)
4D Structure:
Monomer
1D Structure:
3D Image (rendered using PV Viewer):
PDB ID
Subfamily Alignment
Domain Distribution:
| Start | End | Domain |
|---|---|---|
| 44 | 307 | Pkinase |
Post-translation Modifications
For detailed information on phosphorylation of this kinase go to PhosphoNET
Serine phosphorylated:
S22, S31, S96, S344, S361.
Threonine phosphorylated:
T14, T15, T66, T258, T309.
Tyrosine phosphorylated:
Y65, Y69, Y88, Y91, Y263.
Ubiquitinated:
K255, K317.
Distribution
Based on gene microarray analysis from the NCBI
Human Tissue Distribution
% Max Expression:
Mean Expression:
Number of Samples:
Standard Deviation:
% Max Expression:
Mean Expression:
Number of Samples:
Standard Deviation:
 100
100
1398
38
1257
 3
3
37
15
24
 8
8
106
9
75
 13
13
178
138
319
 53
53
735
44
569
 2
2
27
92
25
 2
2
33
47
28
 68
68
948
41
2037
 25
25
355
17
291
 6
6
81
113
71
 3
3
39
30
31
 47
47
652
146
513
 4
4
51
32
74
 2
2
32
9
17
 4
4
59
26
62
 2
2
31
24
21
 3
3
43
179
49
 4
4
56
16
45
 3
3
47
116
34
 44
44
616
165
565
 5
5
70
22
65
 5
5
75
28
78
 7
7
97
13
92
 38
38
537
18
710
 5
5
76
22
63
 45
45
623
86
580
 4
4
53
34
70
 6
6
88
16
67
 6
6
85
18
86
 8
8
117
56
83
 48
48
675
36
571
 28
28
392
46
437
 5
5
68
96
152
 57
57
792
104
670
 38
38
531
61
836
Evolution
Species Conservation
PhosphoNET % Identity:
PhosphoNET % Similarity:
Homologene %
Identity:
PhosphoNET % Identity:
PhosphoNET % Similarity:
Homologene %
Identity:
 100
100
100
100 93.8
93.8
94.1
100 98.1
98.1
98.1
100 -
-
-
98 -
-
-
97 99.3
99.3
99.8
99 -
-
-
- 89.3
89.3
91.1
98 86
86
87.9
94 -
-
-
- -
-
-
- 87.7
87.7
90.1
94 82
82
86.1
93 89.8
89.8
94.3
90 -
-
-
- 41.1
41.1
60.9
70 -
-
-
- -
-
-
66 -
-
-
- -
-
-
- -
-
-
- -
-
-
- 44
44
61.8
- 36.3
36.3
50.9
- -
-
-
-
For a wider analysis go to PhosphoNET Evolution in PhosphoNET
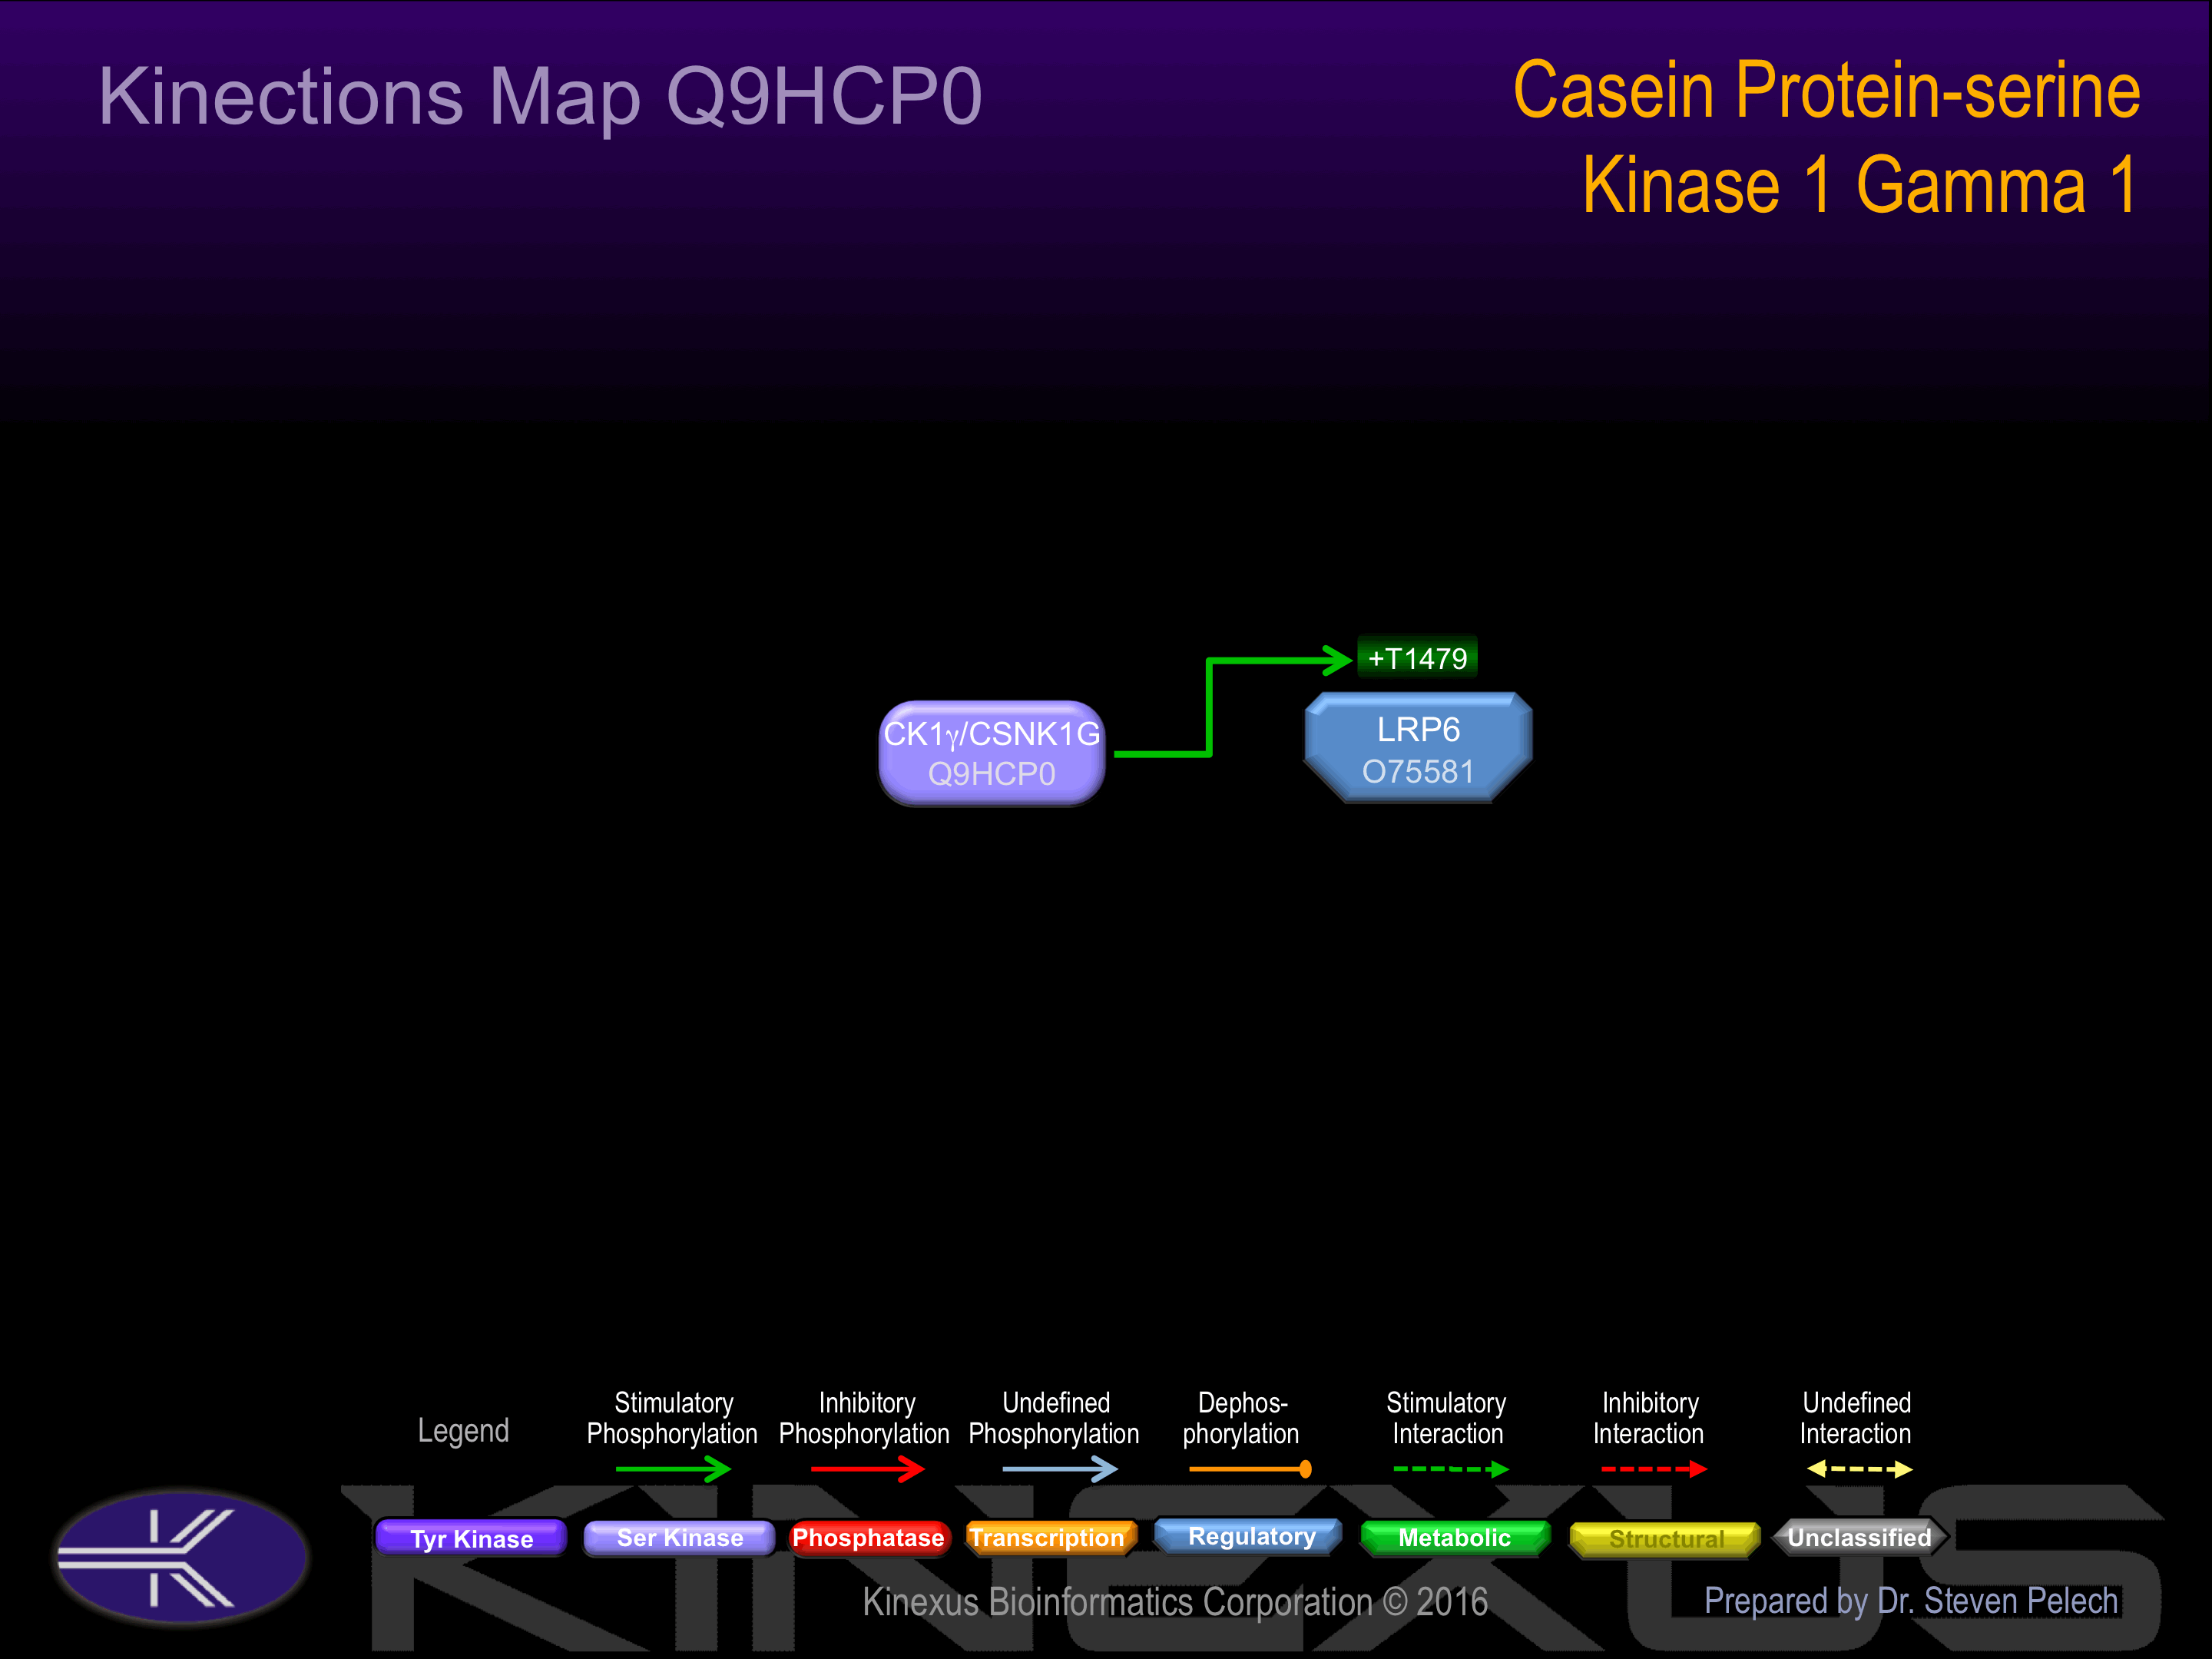
Binding Proteins
Examples of known interacting proteins
hiddentext
| No. | Name – UniProt ID |
|---|---|
| 1 | FOXO1 - Q12778 |
| 2 | PPP1R14A - Q96A00 |
| 3 | CSNK1G2 - P78368 |
| 4 | CSNK1G3 - Q9Y6M4 |
| 5 | CSNK1D - P48730 |
| 6 | CSNK1E - P49674 |
Regulation
Activation:
NA
Inhibition:
NA
Synthesis:
NA
Degradation:
NA
Known Downstream Substrates
For further details on these substrates click on the Substrate Short Name or UniProt ID. Phosphosite Location is hyperlinked to PhosphoNET
predictions.
Based on in vitro and/or in vivo phosphorylation data
| Substrate Short Name | UniProt ID (Human) | Phosphosite Location | Phosphosite Sequence | Effect of Phosphorylation |
|---|
Protein Kinase Specificity
Matrix of observed frequency (%) of amino acids in aligned protein substrate phosphosites
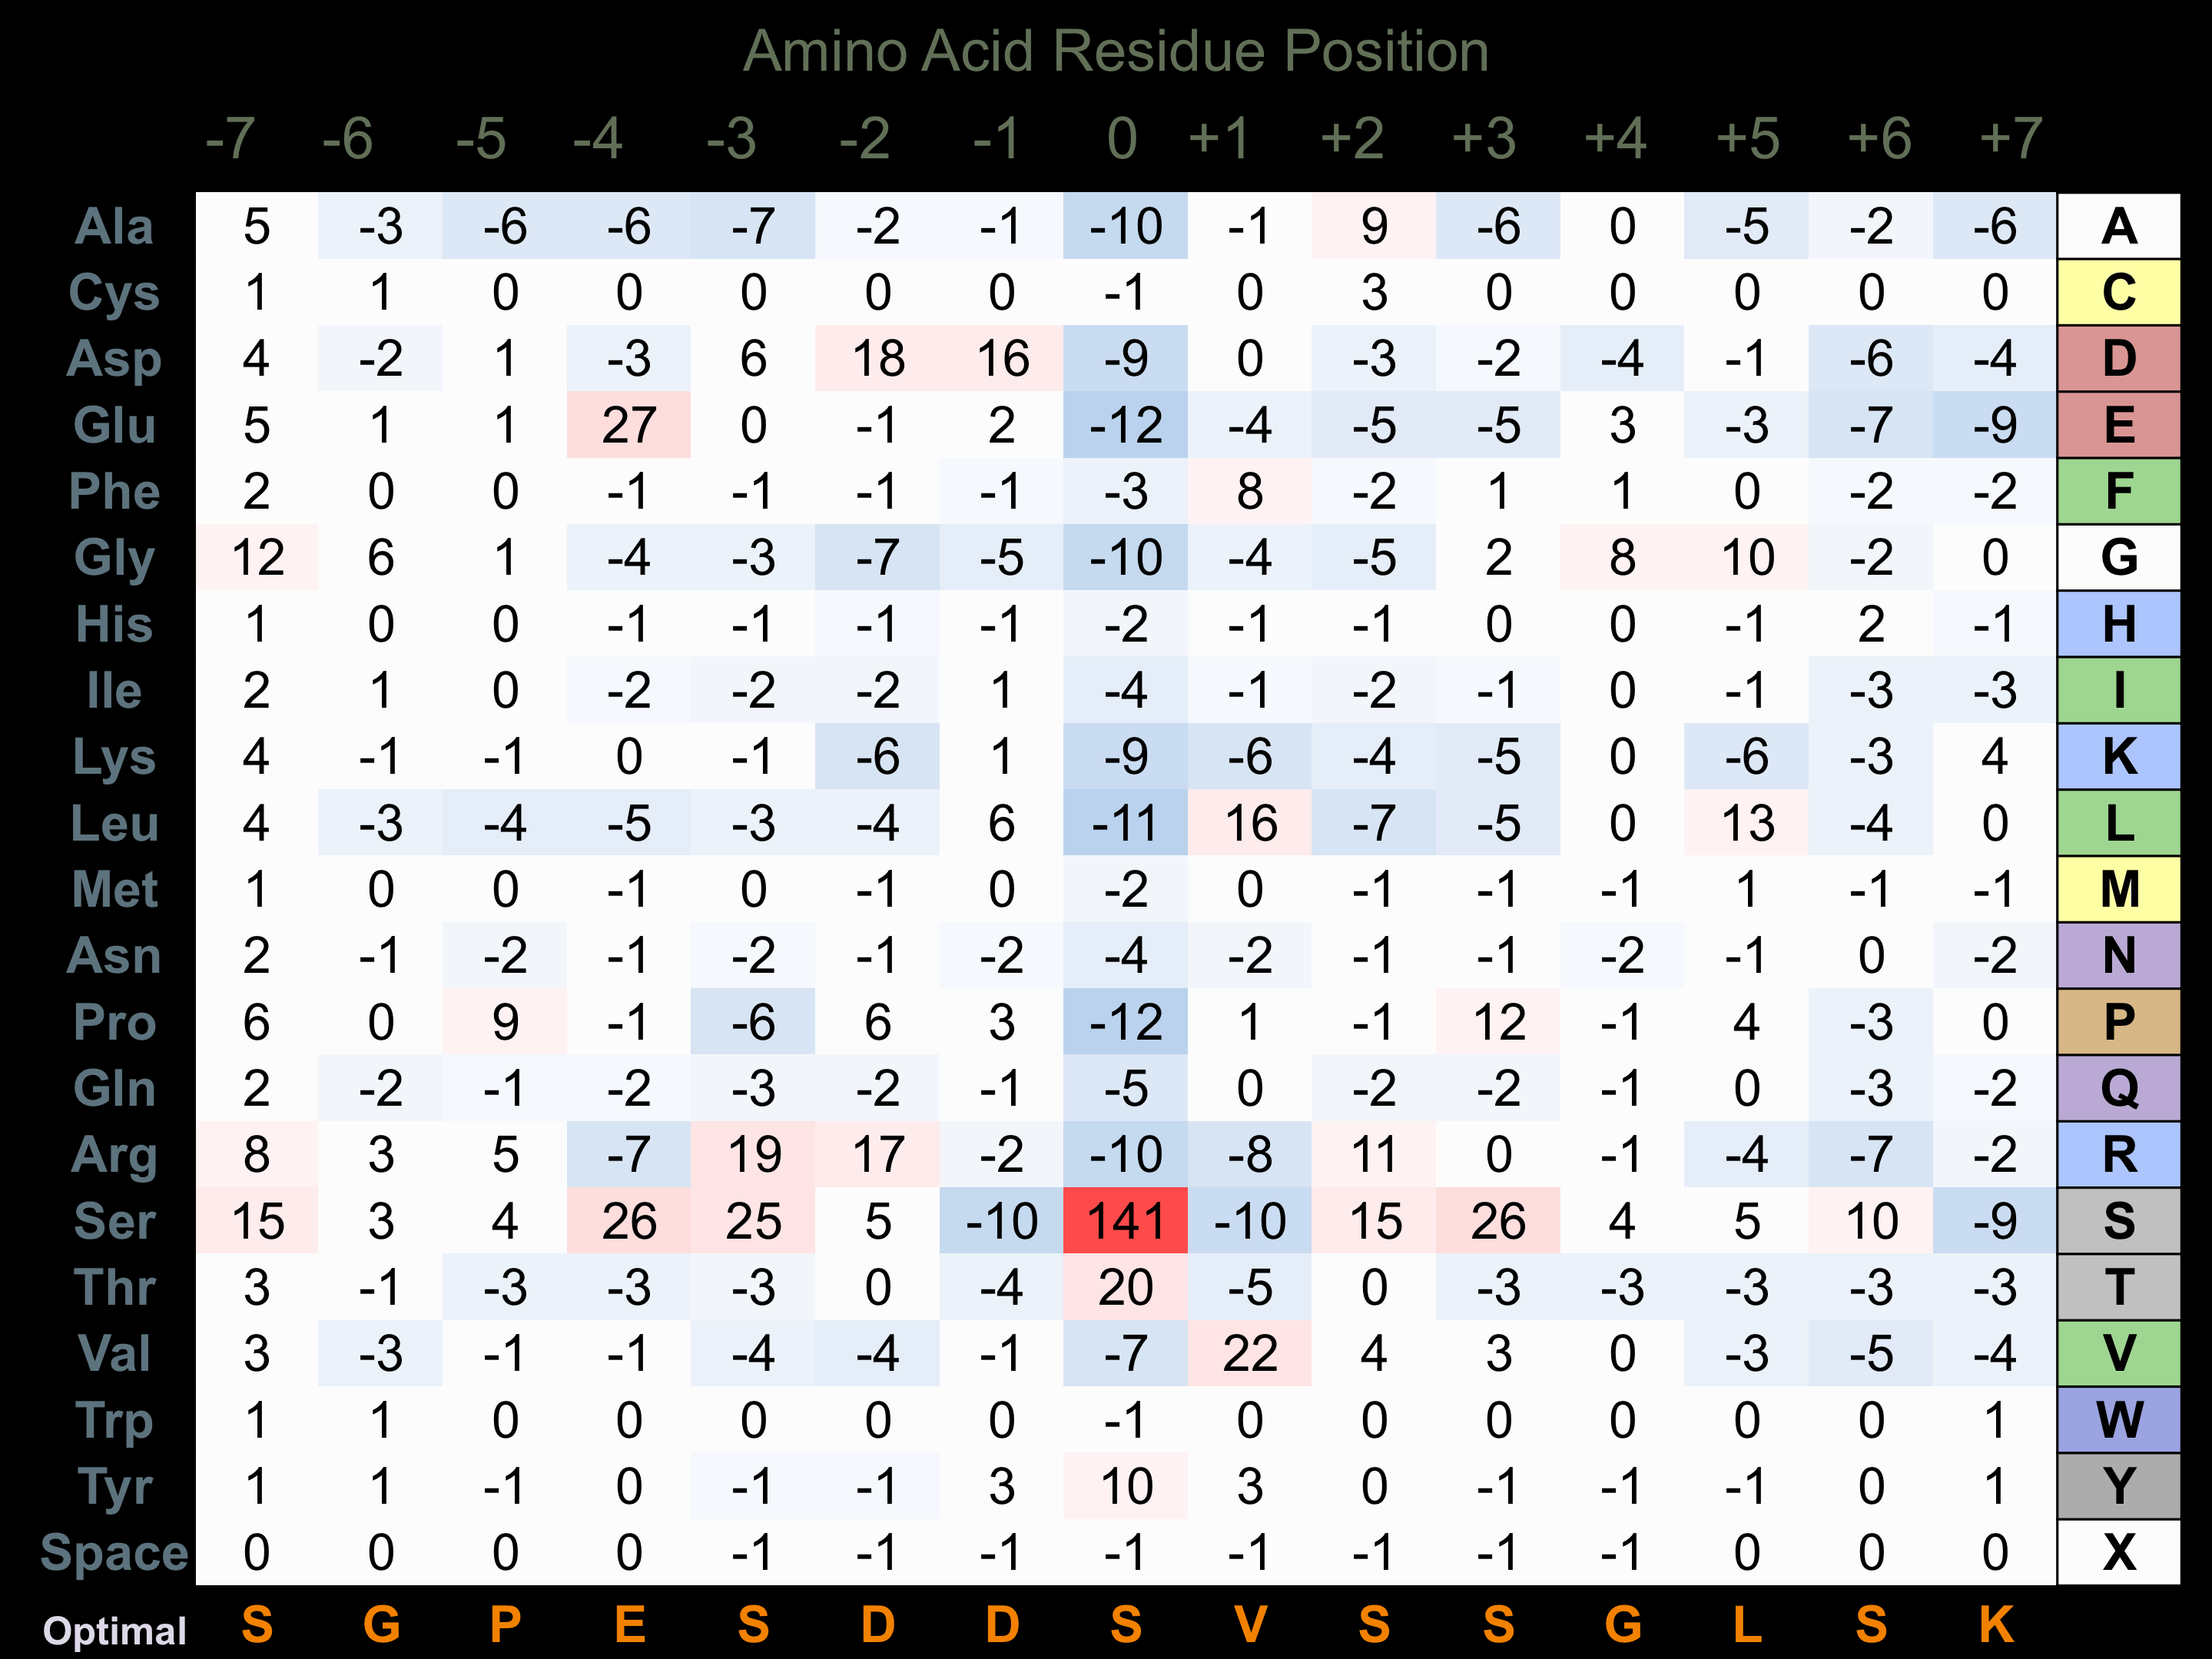
Matrix Type:
Predicted from the application of the Kinexus Kinase Substrate Predictor Version 2.0 algorithm, which was trained with over 10,000 kinase-protein substrate pairs and 8,000 kinase-peptide substrate pairs.
Domain #:
1
Inhibitors
For further details on these inhibitors click on the Compound Name and enter it into DrugKiNET or click on the ID's
Based on in vitro and/or in vivo phosphorylation data
| Compound Name | KD, Ki or IC50 (nM) | PubChem ID | ChEMBL ID | PubMed ID |
|---|
Disease Linkage
Comments:
Variations in CSNK1G1 gene may be associated with early infantile epileptic encephalopathy. N169A mutation leads to loss of kinase activity.
Gene Expression in Cancers:
TranscriptoNET (www.transcriptonet.ca) analysis with mRNA expression data retrieved from the National Center for Biotechnology Information's Gene Expression Omnibus (GEO) database, which was normalized against 60 abundantly and commonly found proteins, indicated altered expression for this protein kinase as shown here as the percent change from normal tissue controls (%CFC) as supported with the Student T-test in the following types of human cancers: Brain oligodendrogliomas (%CFC= +237, p<0.063); and Clear cell renal cell carcinomas (cRCC) stage I (%CFC= +541, p<0.0001).
Mutagenesis Experiments:
Insertional mutagenesis studies in mice have not yet revealed a role for this protein kinase in mouse cancer oncogenesis.
Mutation Rate in All Cancers:
Percent mutation rates per 100 amino acids length in human cancers: 0.06 % in 24447 diverse cancer specimens. This rate is only -26 % lower than the average rate of 0.075 % calculated for human protein kinases in general.
Mutation Rate in Specific Cancers:
Highest percent mutation rates per 100 amino acids length in human cancers: 0.2 % in 603 endometrium cancers tested; 0.19 % in 864 skin cancers tested; 0.12 % in 589 stomach cancers tested.
Frequency of Mutated Sites:
None > 3 in 19,995 cancer specimens
Comments:
Only 1 deletion, and no insertions or complex mutations are noted on the COSMIC website.