
Nomenclature
Short Name:
MST3
Full Name:
Serine-threonine-protein kinase 24
Alias:
- EC 2.7.11.1
- MST3 isoform B
- STK24
- STK3
- MST3b
- RP11-111L24.5
- Serine,threonine protein kinase 24
- STE20-like kinase MST3
Classification
Type:
Protein-serine/threonine kinase
Group:
STE
Family:
STE20
SubFamily:
YSK

Specific Links
Structure
Mol. Mass (Da):
49,308
# Amino Acids:
443
# mRNA Isoforms:
2
mRNA Isoforms:
49,308 Da (443 AA; Q9Y6E0); 47,913 Da (431 AA; Q9Y6E0-2)
4D Structure:
NA
1D Structure:
3D Image (rendered using PV Viewer):
PDB ID
Subfamily Alignment
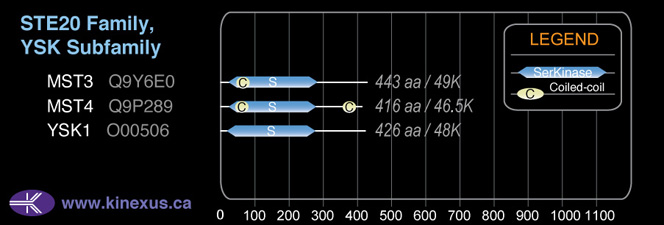
Domain Distribution:
| Start | End | Domain |
|---|---|---|
| 36 | 286 | Pkinase |
| 62 | 89 | Coiled-coil |
Kinexus Products
Click on entries below for direct links to relevant products from Kinexus for this protein kinase.
hiddentext
Post-translation Modifications
For detailed information on phosphorylation of this kinase go to PhosphoNET
Serine phosphorylated:
S49, S46, S294, S311, S315, S316, S317, S320, S434.
Threonine phosphorylated:
T18+, T182, T184+, T190+, T194-, T324.
Tyrosine phosphorylated:
Y93, Y303, Y433.
Ubiquitinated:
K44, K52, K187, K238, K292.
Distribution
Based on gene microarray analysis from the NCBI
Human Tissue Distribution
% Max Expression:
Mean Expression:
Number of Samples:
Standard Deviation:
% Max Expression:
Mean Expression:
Number of Samples:
Standard Deviation:
 32
32
935
45
868
 11
11
321
20
290
 100
100
2906
13
3094
 33
33
953
144
1047
 39
39
1122
36
892
 14
14
417
117
428
 33
33
956
43
908
 49
49
1425
62
1540
 33
33
950
24
640
 20
20
591
117
1132
 18
18
515
44
752
 36
36
1060
227
969
 31
31
901
46
1727
 8
8
230
15
212
 34
34
982
35
1582
 11
11
325
22
304
 22
22
634
334
2950
 47
47
1357
24
1911
 15
15
438
121
741
 34
34
974
162
799
 26
26
743
32
982
 41
41
1184
38
1857
 63
63
1823
16
2181
 41
41
1198
24
1617
 48
48
1392
32
1989
 69
69
2016
85
2594
 43
43
1248
49
2493
 48
48
1386
24
1730
 55
55
1596
24
2372
 8
8
232
42
191
 33
33
949
42
737
 31
31
909
51
782
 14
14
406
51
368
 49
49
1427
78
834
 58
58
1681
48
2741
Evolution
Species Conservation
PhosphoNET % Identity:
PhosphoNET % Similarity:
Homologene %
Identity:
PhosphoNET % Identity:
PhosphoNET % Similarity:
Homologene %
Identity:
 100
100
100
100 99.8
99.8
100
98 39.8
39.8
58.1
98 -
-
-
97 -
-
-
96 49.7
49.7
58.8
97 -
-
-
- 93
93
94.8
98 40.3
40.3
55.8
97 -
-
-
- 86.5
86.5
90.5
- 39.5
39.5
57
90 39.8
39.8
55.8
88 39.2
39.2
55.7
84 -
-
-
- 29.3
29.3
43.8
74 -
-
-
- 35.6
35.6
52.9
59 -
-
-
- -
-
-
- -
-
-
- -
-
-
60 -
-
-
- -
-
-
- -
-
-
61
For a wider analysis go to PhosphoNET Evolution in PhosphoNET
Binding Proteins
Examples of known interacting proteins
hiddentext
| No. | Name – UniProt ID |
|---|---|
| 1 | STRN4 - Q9NRL3 |
| 2 | STRN - O43815 |
| 3 | PPP2R1A - P30153 |
| 4 | MOBKL3 - Q9Y3A3 |
| 5 | SLMAP - Q14BN4 |
| 6 | PPP2R1B - P30154 |
| 7 | FGFR1OP2 - Q9NVK5 |
| 8 | PPP2CA - P67775 |
| 9 | CCT8 - P50990 |
| 10 | CCT2 - P78371 |
| 11 | CCT7 - Q99832 |
| 12 | CCT6A - P40227 |
| 13 | CTTNBP2NL - Q9P2B4 |
| 14 | CTTNBP2 - Q8WZ74 |
| 15 | TCP1 - P17987 |
Regulation
Activation:
NA
Inhibition:
NA
Synthesis:
NA
Degradation:
NA
Known Upstream Kinases
For further details on these substrates click on the Substrate Short Name or UniProt ID. Phosphosite Location is hyperlinked to PhosphoNET
predictions.
Based on in vitro and/or in vivo phosphorylation data
| Kinase Short Name | UniProt ID (Human) | Phosphosite Location | Phosphosite Sequence | Effect of Phosphorylation |
|---|
Known Downstream Substrates
For further details on these substrates click on the Substrate Short Name or UniProt ID. Phosphosite Location is hyperlinked to PhosphoNET
predictions.
Based on in vitro and/or in vivo phosphorylation data
| Substrate Short Name | UniProt ID (Human) | Phosphosite Location | Phosphosite Sequence | Effect of Phosphorylation |
|---|
| MST3 (STK24) | Q9Y6E0 | T190 | DTQIKRNTFVGTPFW | + |
| NDR2 (STK38L) | Q9Y2H1 | T442 | DWVFLNYTYKRFEGL | + |
Protein Kinase Specificity
Matrix of observed frequency (%) of amino acids in aligned protein substrate phosphosites
Matrix Type:
Experimentally derived from alignment of 2 known protein substrate phosphosites and 31 peptides phosphorylated by recombinant MST3 in vitro tested in-house by Kinexus.
Domain #:
1
Inhibitors
For further details on these inhibitors click on the Compound Name and enter it into DrugKiNET or click on the ID's
Based on in vitro and/or in vivo phosphorylation data
| Compound Name | KD, Ki or IC50 (nM) | PubChem ID | ChEMBL ID | PubMed ID |
|---|
Disease Linkage
Gene Expression in Cancers:
TranscriptoNET (www.transcriptonet.ca) analysis with mRNA expression data retrieved from the National Center for Biotechnology Information's Gene Expression Omnibus (GEO) database, which was normalized against 60 abundantly and commonly found proteins, indicated altered expression for this protein kinase as shown here as the percent change from normal tissue controls (%CFC) as supported with the Student T-test in the following types of human cancers: Bladder carcinomas (%CFC= +129, p<0.003); Brain glioblastomas (%CFC= +105, p<0.003); and Large B-cell lymphomas (%CFC= +98, p<0.09). The COSMIC website notes an up-regulated expression score for MST3 in diverse human cancers of 707, which is 1.5-fold of the average score of 462 for the human protein kinases. The down-regulated expression score of 273 for this protein kinase in human cancers was 4.6-fold of the average score of 60 for the human protein kinases.
Mutagenesis Experiments:
Insertional mutagenesis studies in mice support a role for this protein kinase in mouse cancer oncogenesis.
Mutation Rate in All Cancers:
Percent mutation rates per 100 amino acids length in human cancers: 0.07 % in 25371 diverse cancer specimens. This rate is the same as the average rate of 0.075 % calculated for human protein kinases in general.
Mutation Rate in Specific Cancers:
Highest percent mutation rates per 100 amino acids length in human cancers: 0.45 % in 603 endometrium cancers tested; 0.44 % in 864 skin cancers tested; 0.35 % in 65 Meninges cancers tested; 0.3 % in 1270 large intestine cancers tested; 0.27 % in 589 stomach cancers tested; 0.13 % in 710 oesophagus cancers tested; 0.11 % in 1634 lung cancers tested; 0.09 % in 1276 kidney cancers tested; 0.08 % in 548 urinary tract cancers tested; 0.04 % in 1512 liver cancers tested; 0.03 % in 891 ovary cancers tested; 0.03 % in 1490 breast cancers tested; 0.03 % in 1467 pancreas cancers tested; 0.02 % in 939 prostate cancers tested; 0.01 % in 2082 central nervous system cancers tested; 0.01 % in 2009 haematopoietic and lymphoid cancers tested.
Frequency of Mutated Sites:
None > 3 in 20,655 cancer specimens
Comments:
Only 2 deletions, 1 insertion, and no complex mutations are noted on the COSMIC website.