
Nomenclature
Short Name:
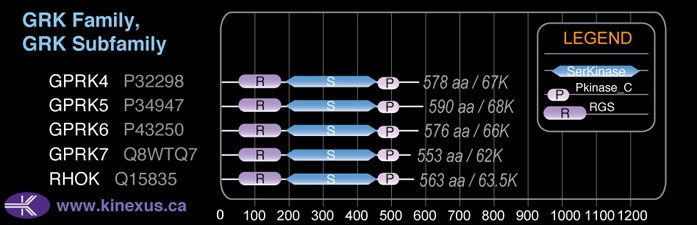
RHOK
Full Name:
Rhodopsin kinase
Alias:
- EC 2.7.11.14
- GRK1
- Rhodopsin kinase
- RK
Classification
Type:
Protein-serine/threonine kinase
Group:
AGC
Family:
GRK
SubFamily:
GRK

Specific Links
Structure
Mol. Mass (Da):
63,526
# Amino Acids:
563
# mRNA Isoforms:
1
mRNA Isoforms:
63,526 Da (563 AA; Q15835)
4D Structure:
NA
1D Structure:
Subfamily Alignment
Domain Distribution:
Kinexus Products
Click on entries below for direct links to relevant products from Kinexus for this protein kinase.
hiddentext
Post-translation Modifications
For detailed information on phosphorylation of this kinase go to PhosphoNET
Acetylated:
K81, K418, K424, K437.
Methylated:
C560 (predicted).
Other:
C560 (S-farnesyl cysteine, predicted).
Serine phosphorylated:
S5+, S21-, S78+, S491.
Threonine phosphorylated:
T8+, T492.
Distribution
Based on gene microarray analysis from the NCBI
Human Tissue Distribution
% Max Expression:
Mean Expression:
Number of Samples:
Standard Deviation:
% Max Expression:
Mean Expression:
Number of Samples:
Standard Deviation:
 56
56
957
13
1228
 2
2
28
13
38
 2
2
30
1
0
 12
12
210
47
427
 11
11
195
17
233
 0.6
0.6
10
37
6
 24
24
417
26
633
 22
22
383
23
590
 8
8
141
13
176
 6
6
100
59
126
 2
2
41
19
59
 24
24
415
110
536
 1.3
1.3
23
12
9
 2
2
30
13
41
 2
2
37
17
45
 1.3
1.3
23
8
32
 2
2
28
186
20
 2
2
33
11
57
 2
2
31
52
21
 12
12
205
59
253
 1.4
1.4
24
15
26
 1.3
1.3
22
18
22
 1.1
1.1
19
2
3
 2
2
27
11
28
 2
2
26
15
30
 24
24
416
28
563
 0.9
0.9
16
18
12
 2
2
28
13
32
 1.2
1.2
21
12
21
 17
17
299
14
107
 20
20
344
18
249
 100
100
1723
33
2629
 23
23
389
52
923
 38
38
655
26
565
 2
2
37
22
35
Evolution
Species Conservation
PhosphoNET % Identity:
PhosphoNET % Similarity:
Homologene %
Identity:
PhosphoNET % Identity:
PhosphoNET % Similarity:
Homologene %
Identity:
 100
100
100
100 46.4
46.4
64.1
99 56.5
56.5
57.7
98 -
-
-
84 -
-
-
- 70.7
70.7
76
87 -
-
-
- 85.6
85.6
94.2
86 86.2
86.2
94.2
86 -
-
-
- 77.9
77.9
90.1
- 55.3
55.3
68.5
- 45
45
66.3
69 28.9
28.9
45.8
69 -
-
-
- 37.5
37.5
52.7
- -
-
-
- 41.9
41.9
59
- -
-
-
- -
-
-
- -
-
-
- -
-
-
- -
-
-
- 24.4
24.4
38.7
- -
-
-
-
For a wider analysis go to PhosphoNET Evolution in PhosphoNET
Binding Proteins
Examples of known interacting proteins
hiddentext
| No. | Name – UniProt ID |
|---|---|
| 1 | RCVRN - P35243 |
| 2 | CALM1 - P62158 |
| 3 | RHO - P08100 |
| 4 | RHOD - O00212 |
| 5 | PDE6D - O43924 |
| 6 | SNCB - Q16143 |
Regulation
Activation:
Phosphorylation of Ser-5 and Thr-8 increases phosphotransferase activity.
Inhibition:
Phosphorylation of Ser-21 inhibits phosphotransferase activity.
Synthesis:
NA
Degradation:
NA
Known Upstream Kinases
For further details on these substrates click on the Substrate Short Name or UniProt ID. Phosphosite Location is hyperlinked to PhosphoNET
predictions.
Based on in vitro and/or in vivo phosphorylation data
| Kinase Short Name | UniProt ID (Human) | Phosphosite Location | Phosphosite Sequence | Effect of Phosphorylation |
|---|
Known Downstream Substrates
For further details on these substrates click on the Substrate Short Name or UniProt ID. Phosphosite Location is hyperlinked to PhosphoNET
predictions.
Based on in vitro and/or in vivo phosphorylation data
| Substrate Short Name | UniProt ID (Human) | Phosphosite Location | Phosphosite Sequence | Effect of Phosphorylation |
|---|
| ADD1 | P35611 | T480 | TKEDGHRTSTSAVPN | + |
| Claudin 5 | O00501 | T207 | YSAPRRPTATGDYDK | |
| CNR2 | P34972 | S352 | KITPWPDSRDLDLSD | |
| Occludin | Q16625 | S508 | KQLKSKLSHIKKMVG | |
| Rhodopsin | P08100 | S334 | PLGDDEASATVSKTE | |
| Rhodopsin | P08100 | S338 | DEASATVSKTETSQV | |
| Rhodopsin | P08100 | S343 | TVSKTETSQVAPA__ | |
| Rhodopsin | P08100 | T340 | ASATVSKTETSQVAP | |
| Rhodopsin | P08100 | T342 | ATVSKTETSQVAPA_ | |
| RHOK | Q15835 | S21 | AFIAARGSFDGSSSQ | - |
| RHOK | Q15835 | S491 | IQDVGAFSTVKGVAF | |
| RHOK | Q15835 | S5 | ___MDFGSLETVVAN | + |
| RHOK | Q15835 | T492 | QDVGAFSTVKGVAFD | |
| RHOK | Q15835 | T8 | MDFGSLETVVANSAF | + |
Protein Kinase Specificity
Matrix of observed frequency (%) of amino acids in aligned protein substrate phosphosites
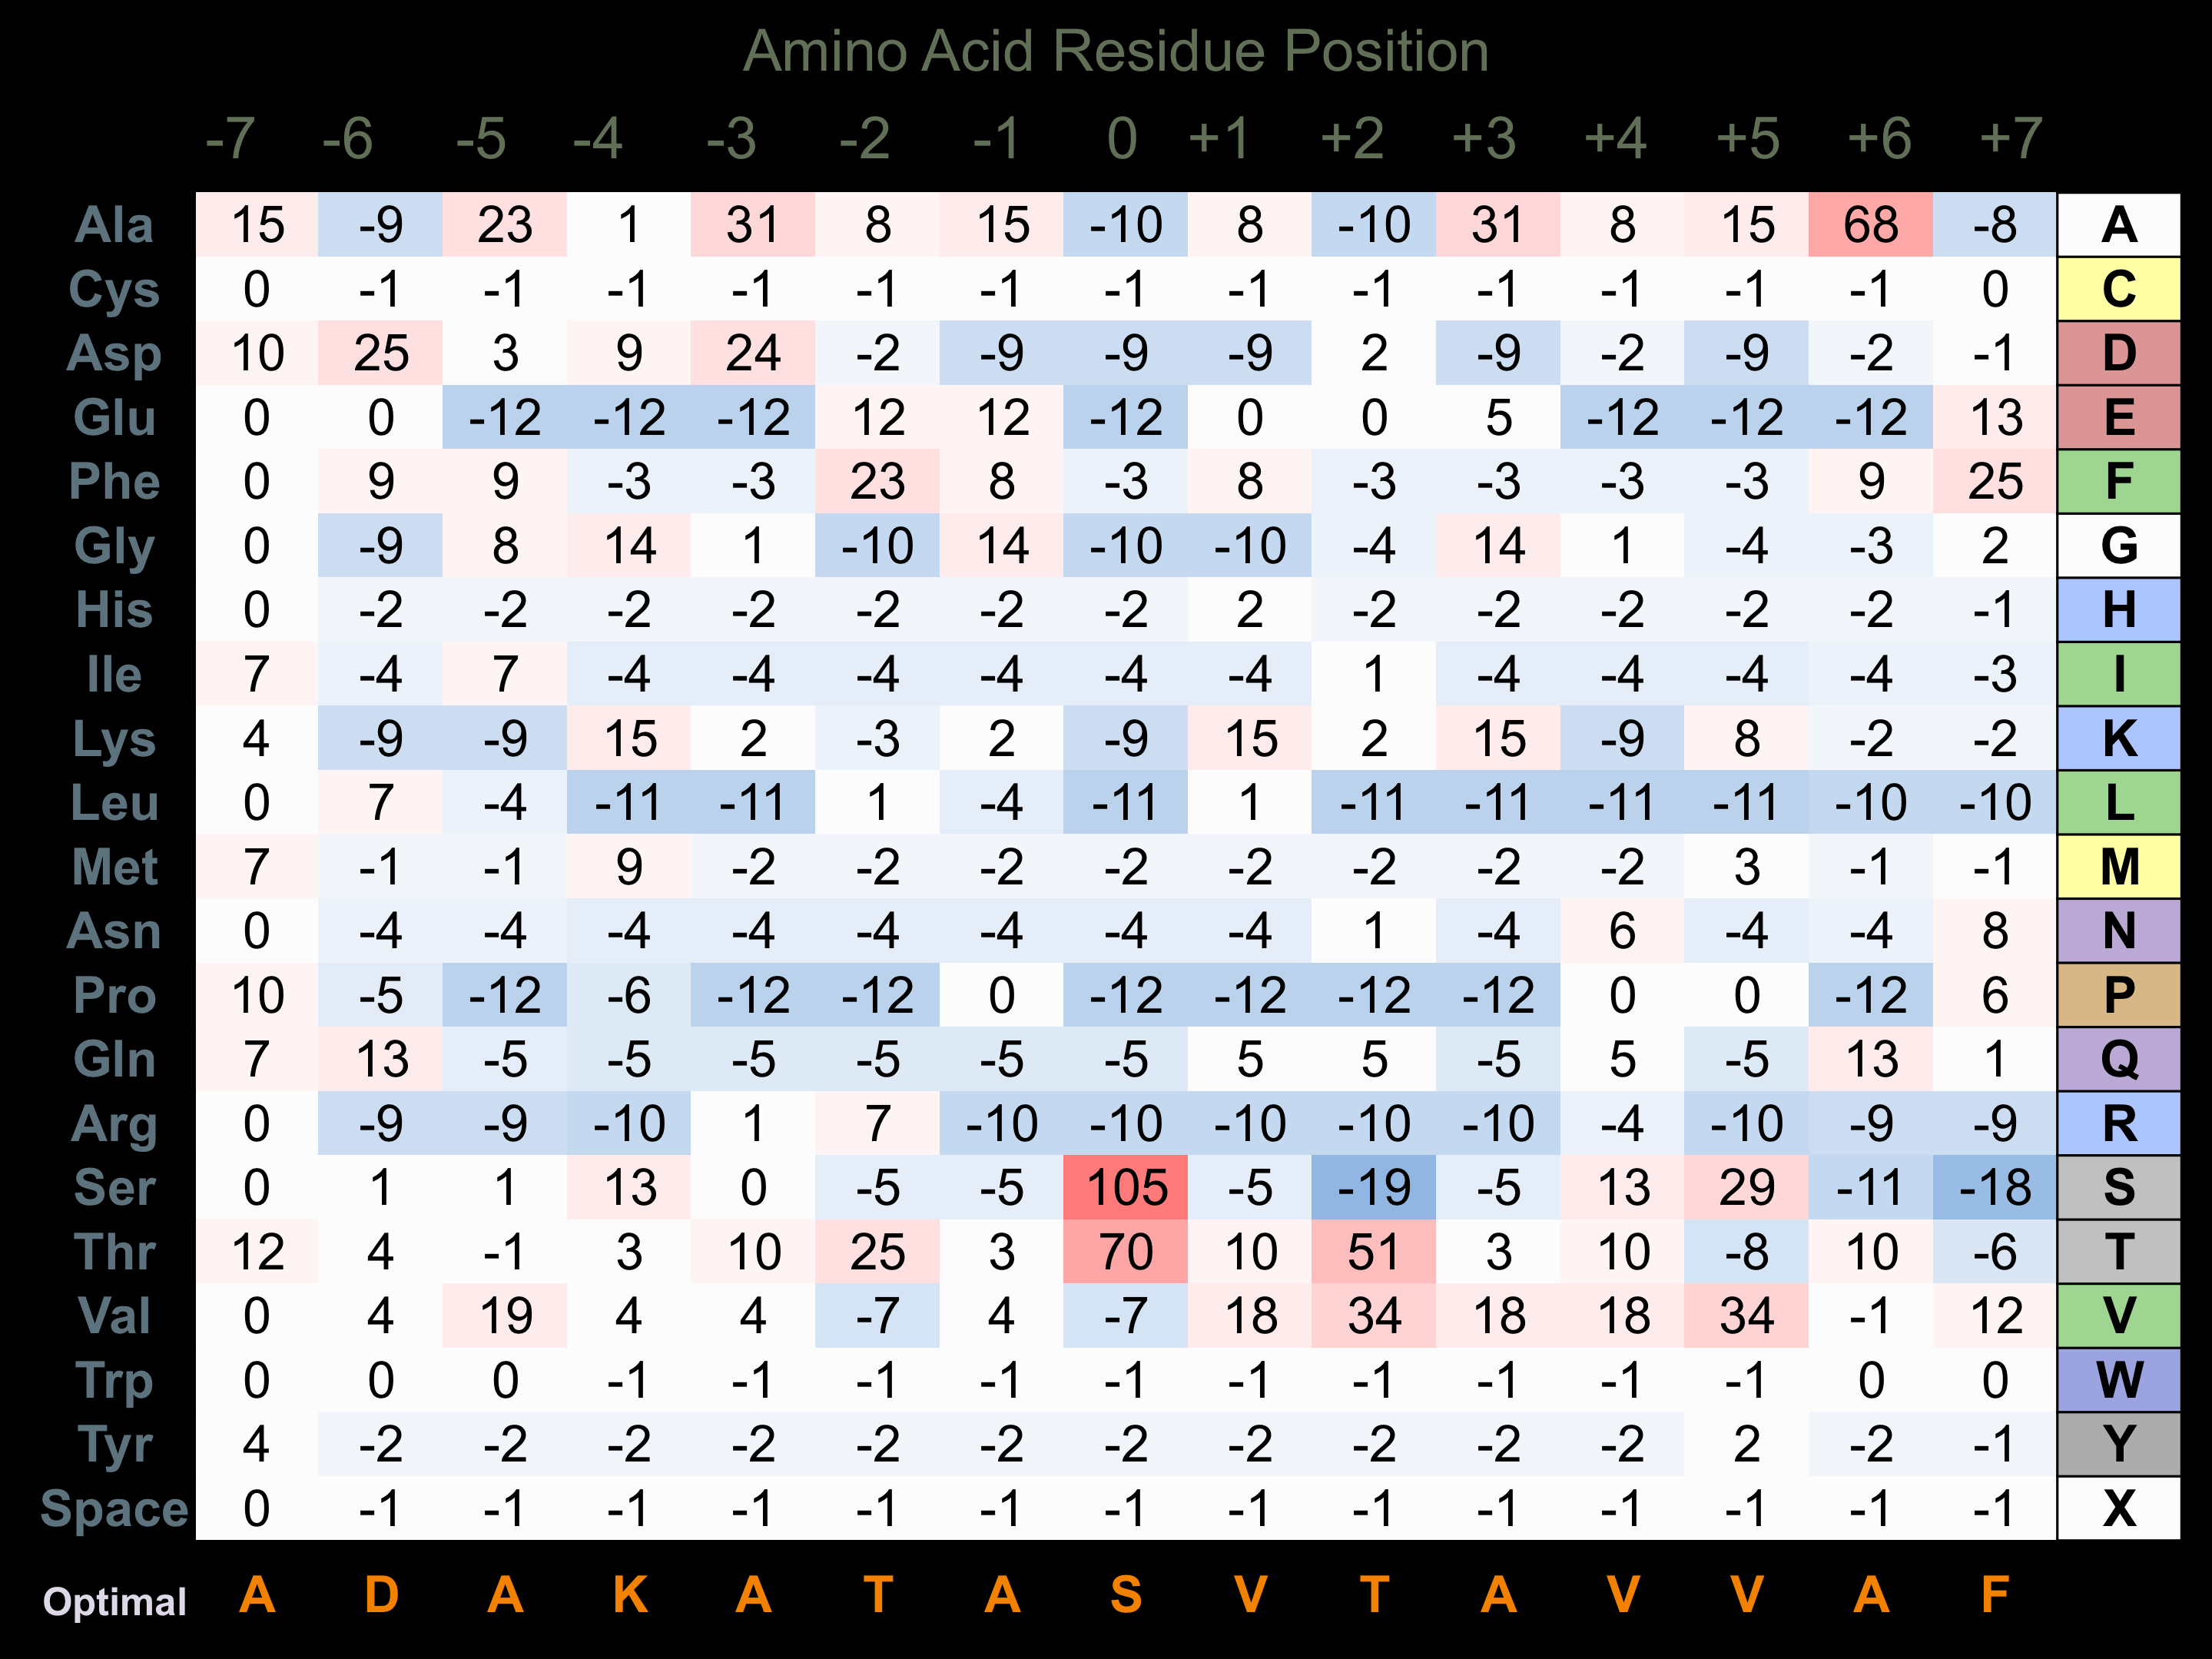
Matrix Type:
Experimentally derived from alignment of 25 known protein substrate phosphosites.
Domain #:
1
Inhibitors
For further details on these inhibitors click on the Compound Name and enter it into DrugKiNET or click on the ID's
Based on in vitro and/or in vivo phosphorylation data
| Compound Name | KD, Ki or IC50 (nM) | PubChem ID | ChEMBL ID | PubMed ID |
|---|
| Staurosporine | Kd = 970 pM | 5279 | 22037378 | |
| Lestaurtinib | Kd = 24 nM | 126565 | 22037378 | |
| N-Benzoylstaurosporine | Kd = 85 nM | 56603681 | 608533 | 19654408 |
| Sunitinib | Kd = 290 nM | 5329102 | 535 | 19654408 |
| Ophiocordin | IC50 = 340 nM | 5287736 | 60254 | 20128603 |
| NVP-TAE684 | Kd = 410 nM | 16038120 | 509032 | 22037378 |
| GSK690693 | Kd = 610 nM | 16725726 | 494089 | 22037378 |
| Alvocidib | Kd = 650 nM | 9910986 | 428690 | 22037378 |
| Ruxolitinib | Kd = 730 nM | 25126798 | 1789941 | 22037378 |
| Ruboxistaurin | Kd = 800 nM | 153999 | 91829 | 22037378 |
| GSK1838705A | Kd = 830 nM | 25182616 | 464552 | 22037378 |
| PP242 | Kd = 930 nM | 25243800 | 22037378 | |
| Nintedanib | Kd = 1 µM | 9809715 | 502835 | 22037378 |
| WZ3146 | Kd > 1 µM | 44607360 | 20033049 | |
| WZ4002 | Kd > 1 µM | 44607530 | 20033049 | |
| PHA-665752 | Kd = 1.1 µM | 10461815 | 450786 | 22037378 |
| SU14813 | Kd = 1.1 µM | 10138259 | 1721885 | 22037378 |
| CHEMBL1240703 | Kd = 1.4 µM | 52945601 | 1240703 | 19654408 |
| Enzastaurin | Kd = 1.7 µM | 176167 | 300138 | 22037378 |
| Dovitinib | Kd = 2.2 µM | 57336746 | 22037378 |
Disease Linkage
General Disease Association:
Eye disorders
Specific Diseases (Non-cancerous):
Blindness; Oguchi disease 2; Fundus albipunctatus; Oguchi disease 1; Night blindness, Congenital stationary, 1d, autosomal recessive; Cone dystrophy; Night blindness, Congenital stationary, 1a, X-linked
Comments:
Oguchi disease is an autosomal recessive eye disease that is a form of congenital stationary eye blindness, which is associated with discolouration of the fundus and impaired dark adaptation. Fundus albipunctatus is a fundus dystrophy characterized by the presence of uniform white dots over the entire structure, with maximal density in the midperiphery and no involvement of the macula. Congenital stationary night blindness is a rare X-linked non-progressive retinal disorder characterized by impaired night vision and often associated with nystagmus and myopia. Mutations in the RHOK gene have been observed in patients with Oguchi disease, including a deletion mutation encompassing exon 5, a missense mutation in the catalytic domain (V380D), and a frameshift mutation at Ser536 resulting in C-terminal truncation of the protein and the absence of isoprenylation, which is required for RHOK activation. Therefore, these mutation are predicted to result in a loss-of-function in the kinase catalytic activity of the RHOK protein, indicating a role for overactive rhodopsin and phototransduction in the pathogenesis of Oguchi disease.
Comments:
RHOK may be a tumour requiring protein (TRP), since it displays extremely low rates of mutation in human cancers.
Gene Expression in Cancers:
The COSMIC website notes an up-regulated expression score for RHOK in diverse human cancers of 484, which is close to the average score of 462 for the human protein kinases. The down-regulated expression score of 0 for this protein kinase in human cancers was 100% lower than average score of 60 for the human protein kinases.
Mutagenesis Experiments:
Insertional mutagenesis studies in mice have not yet revealed a role for this protein kinase in mouse cancer oncogenesis.
Mutation Rate in All Cancers:
Percent mutation rates per 100 amino acids length in human cancers: 0 % in 24984 diverse cancer specimens. This rate is -98 % lower than the average rate of 0.075 % calculated for human protein kinases in general. Such a very low frequency of mutation in human cancers is consistent with this protein kinase playing a role as a tumour requiring protein (TRP).
Mutation Rate in Specific Cancers:
Highest percent mutation rates per 100 amino acids length in human cancers: 0.04 % in 833 ovary cancers tested.
Frequency of Mutated Sites:
None > 1 in 20,267 cancer specimens
Comments:
No deletions, insertions or complex mutations are noted on the COSMIC website.