
Nomenclature
Short Name:
ROR1
Full Name:
Tyrosine-protein kinase transmembrane receptor ROR1
Alias:
- EC 2.7.1.112
- EC 2.7.10.1
- NTRKR1
Classification
Type:
Protein-tyrosine kinase
Group:
TK
Family:
Ror
SubFamily:
NA

Structure
Mol. Mass (Da):
104283
# Amino Acids:
937
# mRNA Isoforms:
3
mRNA Isoforms:
104,283 Da (937 AA; Q01973); 43,826 Da (393 AA; Q01973-3); 42,833 Da (388 AA; Q01973-2)
4D Structure:
NA
1D Structure:
Subfamily Alignment
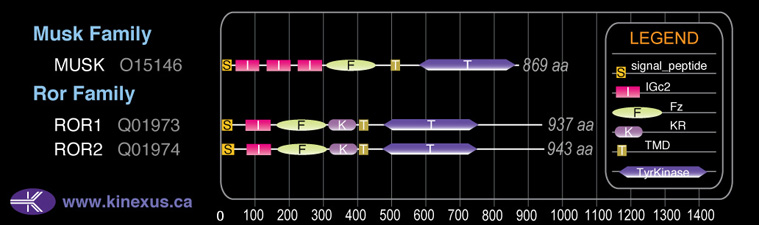
Domain Distribution:
Post-translation Modifications
For detailed information on phosphorylation of this kinase go to PhosphoNET
N-GlcNAcylated:
N41, N66, N184, N315.
Serine phosphorylated:
S161, S576, S577, S652.
Threonine phosphorylated:
T9.
Tyrosine phosphorylated:
Y160, Y173, Y459, Y786, Y789, Y828, Y836.
Ubiquitinated:
K464.
Distribution
Based on gene microarray analysis from the NCBI
Human Tissue Distribution
% Max Expression:
Mean Expression:
Number of Samples:
Standard Deviation:
% Max Expression:
Mean Expression:
Number of Samples:
Standard Deviation:
 100
100
1185
35
1270
 2
2
22
16
25
 4
4
53
6
56
 15
15
173
105
363
 55
55
650
31
461
 2
2
21
83
22
 12
12
145
41
382
 44
44
520
33
619
 23
23
277
17
214
 4
4
49
103
67
 1
1
12
25
8
 57
57
678
175
648
 2
2
21
28
28
 8
8
100
12
108
 5
5
55
17
47
 2
2
19
20
16
 4
4
45
119
29
 2
2
25
14
16
 2
2
25
99
18
 46
46
543
137
514
 2
2
19
19
17
 4
4
42
22
36
 8
8
90
16
41
 1.2
1.2
14
13
7
 2
2
27
19
59
 36
36
421
63
460
 1.4
1.4
16
30
12
 2
2
21
15
11
 6
6
76
15
46
 3
3
36
42
34
 18
18
214
24
218
 39
39
458
41
510
 29
29
341
75
805
 50
50
590
83
557
 5
5
56
48
56
Evolution
Species Conservation
PhosphoNET % Identity:
PhosphoNET % Similarity:
Homologene %
Identity:
PhosphoNET % Identity:
PhosphoNET % Similarity:
Homologene %
Identity:
 100
100
100
100 97.2
97.2
97.5
100 82.4
82.4
82.7
- -
-
-
98 -
-
-
- 90.7
90.7
91.9
98 -
-
-
- 96.7
96.7
98.4
97 96.7
96.7
98.2
97 -
-
-
- 83
83
87.9
- 88
88
92.6
93 56.4
56.4
71.7
88 73.9
73.9
84.8
76.5 -
-
-
- 30.1
30.1
45.3
49.5 32.3
32.3
49.4
- -
-
-
31 -
-
-
- -
-
-
- -
-
-
- -
-
-
- -
-
-
- -
-
-
- -
-
-
-
For a wider analysis go to PhosphoNET Evolution in PhosphoNET
Binding Proteins
Examples of known interacting proteins
hiddentext
| No. | Name – UniProt ID |
|---|---|
| 1 | WNT5A - P41221 |
Regulation
Activation:
NA
Inhibition:
NA
Synthesis:
NA
Degradation:
NA
Protein Kinase Specificity
Matrix of observed frequency (%) of amino acids in aligned protein substrate phosphosites
Matrix Type:
Predicted from the application of the Kinexus Kinase Substrate Predictor Version 2.0 algorithm, which was trained with over 10,000 kinase-protein substrate pairs and 8,000 kinase-peptide substrate pairs.
Domain #:
1
Disease Linkage
General Disease Association:
Cancer
Specific Cancer Types:
B-cell chronic lymphocytic leukaemia
Comments:
Increased expression of ROR1 is linked with B-cell chronic lymphocytic leukaemia.
Gene Expression in Cancers:
TranscriptoNET (www.transcriptonet.ca) analysis with mRNA expression data retrieved from the National Center for Biotechnology Information's Gene Expression Omnibus (GEO) database, which was normalized against 60 abundantly and commonly found proteins, indicated altered expression for this protein kinase as shown here as the percent change from normal tissue controls (%CFC) as supported with the Student T-test in the following types of human cancers: Gastric cancer (%CFC= -51, p<0.001); Lung adenocarcinomas (%CFC= -55, p<0.0001); Malignant pleural mesotheliomas (MPM) tumours (%CFC= +86, p<0.012); Ovary adenocarcinomas (%CFC= -48, p<0.044); Papillary thyroid carcinomas (PTC) (%CFC= +61, p<0.028); and Skin melanomas - malignant (%CFC= -63, p<0.0005). The COSMIC website notes an up-regulated expression score for ROR1 in diverse human cancers of 401, which is 0.9-fold of the average score of 462 for the human protein kinases. The down-regulated expression score of 0 for this protein kinase in human cancers was 100% lower than the average score of 60 for the human protein kinases.
Mutagenesis Experiments:
Insertional mutagenesis studies in mice have not yet revealed a role for this protein kinase in mouse cancer oncogenesis.
Mutation Rate in All Cancers:
Percent mutation rates per 100 amino acids length in human cancers: 0.08 % in 25649 diverse cancer specimens. This rate is very similar (+ 8% higher) to the average rate of 0.075 % calculated for human protein kinases in general.
Mutation Rate in Specific Cancers:
Highest percent mutation rates per 100 amino acids length in human cancers: 0.5 % in 805 skin cancers tested; 0.4 % in 1269 large intestine cancers tested; 0.25 % in 589 stomach cancers tested; 0.11 % in 1503 breast cancers tested; 0.08 % in 1943 lung cancers tested.
Frequency of Mutated Sites:
Most frequent mutations with the number of reports indicated in brackets: T69M (4).
Comments:
Only 4 deletions, no insertions or complex mutations.