
Nomenclature
Short Name:
SGK3
Full Name:
Serine-threonine-protein kinase Sgk3
Alias:
- CISK
- EC 2.7.11.1
- SGK2
- SGKL
- SGK-like protein SGKL
- Serine/threonine protein kinase CISK
- Serum/glucocorticoid regulated kinase family, member 3
- Serum/glucocorticoid-regulated kinase 3
- Serum/glucocorticoid-regulated kinase-like
Classification
Type:
Protein-serine/threonine kinase
Group:
AGC
Family:
SGK
SubFamily:
NA

Specific Links
Structure
Mol. Mass (Da):
57,108
# Amino Acids:
496
# mRNA Isoforms:
2
mRNA Isoforms:
57,108 Da (496 AA; Q96BR1); 53,306 Da (464 AA; Q96BR1-2)
4D Structure:
NA
1D Structure:
Subfamily Alignment
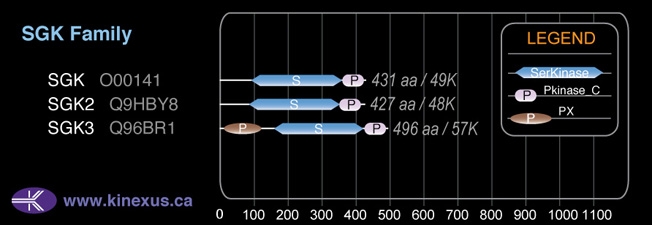
Domain Distribution:
Kinexus Products
Click on entries below for direct links to relevant products from Kinexus for this protein kinase.
hiddentext
Post-translation Modifications
For detailed information on phosphorylation of this kinase go to PhosphoNET
Methylated:
K75.
Serine phosphorylated:
S126, S129, S315, S486.
Threonine phosphorylated:
T318+, T319+, T320+, T324.
Tyrosine phosphorylated:
Y188.
Ubiquitinated:
K191.
Distribution
Based on gene microarray analysis from the NCBI
Human Tissue Distribution
% Max Expression:
Mean Expression:
Number of Samples:
Standard Deviation:
% Max Expression:
Mean Expression:
Number of Samples:
Standard Deviation:
 18
18
1351
9
1031
 0.6
0.6
47
4
53
 0.4
0.4
28
15
20
 4
4
294
47
317
 17
17
1281
13
841
 3
3
259
9
72
 3
3
251
13
137
 4
4
311
24
798
 0.4
0.4
31
3
1
 4
4
319
44
265
 0.9
0.9
64
20
45
 5
5
353
37
639
 1
1
74
15
43
 0.4
0.4
26
3
3
 3
3
195
5
169
 2
2
117
5
47
 1.3
1.3
93
84
75
 0.7
0.7
52
18
37
 1.1
1.1
85
36
69
 17
17
1279
31
720
 3
3
193
20
143
 0.5
0.5
40
20
69
 0.7
0.7
54
15
32
 0.6
0.6
47
18
38
 0.8
0.8
61
20
77
 8
8
578
38
730
 0.4
0.4
32
18
26
 0.8
0.8
56
18
36
 0.6
0.6
46
18
30
 1.3
1.3
96
14
46
 13
13
943
24
494
 100
100
7419
8
14075
 7
7
501
42
910
 26
26
1956
26
330
 6
6
426
31
576
Evolution
Species Conservation
PhosphoNET % Identity:
PhosphoNET % Similarity:
Homologene %
Identity:
PhosphoNET % Identity:
PhosphoNET % Similarity:
Homologene %
Identity:
 100
100
100
100 99.8
99.8
99.8
100 48
48
59.8
99 -
-
-
98 -
-
-
- 97.6
97.6
98.4
99 -
-
-
- 96.8
96.8
98.4
97 96.6
96.6
98.4
94 -
-
-
- 95
95
96.8
- 58.9
58.9
70.4
94 56.5
56.5
69.3
77 59.1
59.1
70.6
79 -
-
-
- 34.7
34.7
48.6
- -
-
-
- 44.6
44.6
59.7
- 56.6
56.6
68.8
- -
-
-
- -
-
-
- -
-
-
- -
-
-
- 32.4
32.4
45.2
- -
-
-
-
For a wider analysis go to PhosphoNET Evolution in PhosphoNET
Binding Proteins
Examples of known interacting proteins
hiddentext
| No. | Name – UniProt ID |
|---|---|
| 1 | GSK3B - P49841 |
| 2 | PDPK1 - O15530 |
| 3 | PDPK2 - Q6A1A2 |
| 4 | PDK1 - Q15118 |
| 5 | SLC9A3R2 - Q15599 |
| 6 | GSK3A - P49840 |
Regulation
Activation:
Two specific sites, one in the kinase domain (Thr-320) and the other in the C-terminal regulatory region (Ser-486), need to be phosphorylated for its full activation.
Inhibition:
NA
Synthesis:
NA
Degradation:
NA
Known Upstream Kinases
For further details on these substrates click on the Substrate Short Name or UniProt ID. Phosphosite Location is hyperlinked to PhosphoNET
predictions.
Based on in vitro and/or in vivo phosphorylation data
| Kinase Short Name | UniProt ID (Human) | Phosphosite Location | Phosphosite Sequence | Effect of Phosphorylation |
|---|
Protein Kinase Specificity
Matrix of observed frequency (%) of amino acids in aligned protein substrate phosphosites
Matrix Type:
Predicted from the application of the Kinexus Kinase Substrate Predictor Version 2.0 algorithm, which was trained with over 10,000 kinase-protein substrate pairs and 8,000 kinase-peptide substrate pairs.
Domain #:
1
Inhibitors
For further details on these inhibitors click on the Compound Name and enter it into DrugKiNET or click on the ID's
Based on in vitro and/or in vivo phosphorylation data
| Compound Name | KD, Ki or IC50 (nM) | PubChem ID | ChEMBL ID | PubMed ID |
|---|
Disease Linkage
General Disease Association:
Cancer
Specific Cancer Types:
Prostate cancer
Comments:
SGK3 can also be induced by androgen, and may promote prostate cancer cell proliferation.
Gene Expression in Cancers:
TranscriptoNET (www.transcriptonet.ca) analysis with mRNA expression data retrieved from the National Center for Biotechnology Information's Gene Expression Omnibus (GEO) database, which was normalized against 60 abundantly and commonly found proteins, indicated altered expression for this protein kinase as shown here as the percent change from normal tissue controls (%CFC) as supported with the Student T-test in the following types of human cancers: Breast epithelial carcinomas (%CFC= -81, p<0.006); Breast epithelial hyperplastic enlarged lobular units (HELU) (%CFC= +297, p<0.075); Large B-cell lymphomas (%CFC= +79, p<0.031); Ovary adenocarcinomas (%CFC= -68, p<(0.0003); and Papillary thyroid carcinomas (PTC) (%CFC= +84, p<0.021). The COSMIC website notes an up-regulated expression score for SGK3 in diverse human cancers of 619, which is 1.3-fold of the average score of 462 for the human protein kinases. The down-regulated expression score of 42 for this protein kinase in human cancers was 0.7-fold of the average score of 60 for the human protein kinases.
Mutagenesis Experiments:
Insertional mutagenesis studies in mice have not yet revealed a role for this protein kinase in mouse cancer oncogenesis.
Mutation Rate in All Cancers:
Percent mutation rates per 100 amino acids length in human cancers: 0.07 % in 25426 diverse cancer specimens. This rate is only -7 % lower and is very similar to the average rate of 0.075 % calculated for human protein kinases in general.
Mutation Rate in Specific Cancers:
Highest percent mutation rates per 100 amino acids length in human cancers: 0.4 % in 1296 large intestine cancers tested; 0.23 % in 603 endometrium cancers tested; 0.18 % in 895 skin cancers tested; 0.18 % in 575 stomach cancers tested; 0.16 % in 127 biliary tract cancers tested; 0.15 % in 273 cervix cancers tested; 0.12 % in 1956 lung cancers tested; 0.12 % in 1512 liver cancers tested; 0.08 % in 238 bone cancers tested; 0.07 % in 548 urinary tract cancers tested; 0.06 % in 710 oesophagus cancers tested; 0.05 % in 1527 breast cancers tested; 0.05 % in 1276 kidney cancers tested; 0.04 % in 939 prostate cancers tested; 0.02 % in 942 upper aerodigestive tract cancers tested; 0.02 % in 891 ovary cancers tested; 0.01 % in 2082 central nervous system cancers tested; 0.01 % in 1467 pancreas cancers tested.
Frequency of Mutated Sites:
Most frequent mutations with the number of reports indicated in brackets: E29K (4); H139R (3).
Comments:
Only 9 deletions, and no insertions or complex mutations are noted on the COSMIC website.