
Nomenclature
Short Name:
TIE1
Full Name:
Tyrosine-protein kinase receptor Tie-1
Alias:
- EC 2.7.1.112
- EC 2.7.10.1
- JTK14
- TIE
- Tie protein
- Tyrosine kinase with immunoglobulin-like and EGF-like domains 1
Classification
Type:
Protein-tyrosine kinase
Group:
TK
Family:
Tie
SubFamily:
NA

Structure
Mol. Mass (Da):
125,090
# Amino Acids:
1138
# mRNA Isoforms:
3
mRNA Isoforms:
125,090 Da (1138 AA; P35590); 40,616 Da (379 AA; P35590-2); 34,138 Da (317 AA; P35590-3)
4D Structure:
1D Structure:
Subfamily Alignment
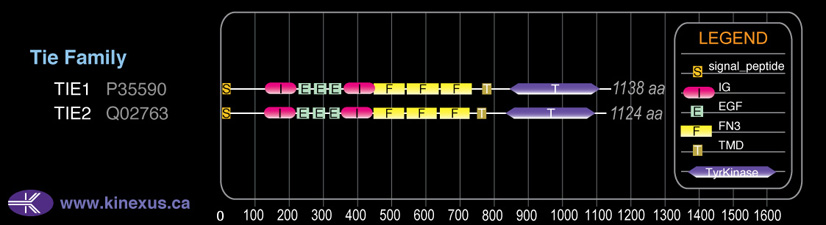
Domain Distribution:
Post-translation Modifications
For detailed information on phosphorylation of this kinase go to PhosphoNET
N-GlcNAcylated:
N83, N161, N503, N596, N709.
Serine phosphorylated:
S472, S478, S565, S567, S598, S599, .
Threonine phosphorylated:
T393, T539, T540, T604, T608, T663, T1011, T1031, T1032.
Tyrosine phosphorylated:
Y912, Y1007+, Y1027, Y1030, Y1083+, Y1117+.
Distribution
Based on gene microarray analysis from the NCBI
Human Tissue Distribution
% Max Expression:
Mean Expression:
Number of Samples:
Standard Deviation:
% Max Expression:
Mean Expression:
Number of Samples:
Standard Deviation:
 68
68
935
22
930
 4
4
51
11
27
 30
30
406
23
447
 13
13
176
91
330
 52
52
709
19
514
 6
6
80
54
176
 10
10
143
29
340
 30
30
415
43
498
 16
16
220
10
202
 10
10
137
67
247
 14
14
198
35
332
 64
64
877
133
833
 29
29
393
34
582
 2
2
31
9
18
 21
21
295
33
624
 3
3
38
13
41
 17
17
234
127
1587
 18
18
243
30
464
 12
12
166
72
337
 39
39
535
79
507
 15
15
200
32
318
 25
25
343
34
442
 41
41
561
32
1845
 13
13
178
30
413
 20
20
280
32
592
 35
35
479
66
521
 12
12
168
37
347
 100
100
1375
30
6640
 38
38
523
30
593
 1
1
16
14
7
 35
35
483
18
354
 42
42
576
26
1077
 16
16
226
55
501
 35
35
480
57
457
 4
4
49
35
90
Evolution
Species Conservation
PhosphoNET % Identity:
PhosphoNET % Similarity:
Homologene %
Identity:
PhosphoNET % Identity:
PhosphoNET % Similarity:
Homologene %
Identity:
 100
100
100
100 99.7
99.7
99.8
100 95.2
95.2
96.2
- -
-
-
93 -
-
-
100 85.6
85.6
88.1
93.5 -
-
-
- 92.5
92.5
95.5
93 25.8
25.8
38
93 -
-
-
- 65.9
65.9
74.3
- 25.1
25.1
39.4
67 -
-
-
62 44.6
44.6
58.8
59 -
-
-
- 22.4
22.4
36
- 24.8
24.8
40.3
- -
-
-
- 22.9
22.9
39.1
- -
-
-
- -
-
-
- -
-
-
- -
-
-
- -
-
-
- -
-
-
-
For a wider analysis go to PhosphoNET Evolution in PhosphoNET
Binding Proteins
Examples of known interacting proteins
hiddentext
| No. | Name – UniProt ID |
|---|---|
| 1 | PIK3R1 - P27986 |
Regulation
Activation:
Phosphorylation of Tyr-1117 induces interaction with PIK3R1.
Inhibition:
NA
Synthesis:
NA
Degradation:
NA
Known Upstream Kinases
For further details on these substrates click on the Substrate Short Name or UniProt ID. Phosphosite Location is hyperlinked to PhosphoNET
predictions.
Based on in vitro and/or in vivo phosphorylation data
| Kinase Short Name | UniProt ID (Human) | Phosphosite Location | Phosphosite Sequence | Effect of Phosphorylation |
|---|
Known Downstream Substrates
For further details on these substrates click on the Substrate Short Name or UniProt ID. Phosphosite Location is hyperlinked to PhosphoNET
predictions.
Based on in vitro and/or in vivo phosphorylation data
| Substrate Short Name | UniProt ID (Human) | Phosphosite Location | Phosphosite Sequence | Effect of Phosphorylation |
|---|
Protein Kinase Specificity
Matrix of observed frequency (%) of amino acids in aligned protein substrate phosphosites
Matrix Type:
Predicted from the application of the Kinexus Kinase Substrate Predictor Version 2.0 algorithm, which was trained with over 10,000 kinase-protein substrate pairs and 8,000 kinase-peptide substrate pairs.
Domain #:
1
Inhibitors
For further details on these inhibitors click on the Compound Name and enter it into DrugKiNET or click on the ID's
Based on in vitro and/or in vivo phosphorylation data
| Compound Name | KD, Ki or IC50 (nM) | PubChem ID | ChEMBL ID | PubMed ID |
|---|
Disease Linkage
Comments:
TIE1 plays a critical role in angiogenesis and blood vessel stability. Embryos with knock-out TIE1 failed to establish structural integrity of vascular endothelial cells, resulting in edema and subsequent localized hemorrhage.Angiopoietin-1 and its receptor TIE1 are critical for the development of the right-hand side venous system, but is dispensable for the left-hand side venous system.
Comments:
TIE1 may be an oncoprotein (OP). TIE1 can potentially be a therapeutic target for reducing tumour growth and angiogenesis.
Gene Expression in Cancers:
TranscriptoNET (www.transcriptonet.ca) analysis with mRNA expression data retrieved from the National Center for Biotechnology Information's Gene Expression Omnibus (GEO) database, which was normalized against 60 abundantly and commonly found proteins, indicated altered expression for this protein kinase as shown here as the percent change from normal tissue controls (%CFC) as supported with the Student T-test in the following types of human cancers: Clear cell renal cell carcinomas (cRCC) (%CFC= +300, p<0.024); Lung adenocarcinomas (%CFC= -75, p<0.0001); Skin fibrosarcomas (%CFC= +90); and Uterine leiomyomas from fibroids (%CFC= -48, p<0.001). The COSMIC website notes an up-regulated expression score for TIE1 in diverse human cancers of 343, which is 0.7-fold of the average score of 462 for the human protein kinases. The down-regulated expression score of 13 for this protein kinase in human cancers was 0.2-fold of the average score of 60 for the human protein kinases.
Mutagenesis Experiments:
Insertional mutagenesis studies in mice have not yet revealed a role for this protein kinase in mouse cancer oncogenesis.
Mutation Rate in All Cancers:
Percent mutation rates per 100 amino acids length in human cancers: 0.11 % in 25420 diverse cancer specimens. This rate is a modest 1.4-fold higher than the average rate of 0.075 % calculated for human protein kinases in general.
Mutation Rate in Specific Cancers:
Highest percent mutation rates per 100 amino acids length in human cancers: 0.68 % in 854 skin cancers tested; 0.51 % in 1093 large intestine cancers tested; 0.39 % in 589 stomach cancers tested; 0.2 % in 602 endometrium cancers tested; 0.17 % in 1941 lung cancers tested; 0.15 % in 830 upper aerodigestive tract cancers tested; 0.04 % in 1962 central nervous system cancers tested.
Frequency of Mutated Sites:
Most frequent mutations with the number of reports indicated in brackets: Q601P (6); R437Q (4).
Comments:
Eleven deletions, and no insertions or complex mutations are noted on the COSMIC website.