
Nomenclature
Short Name:
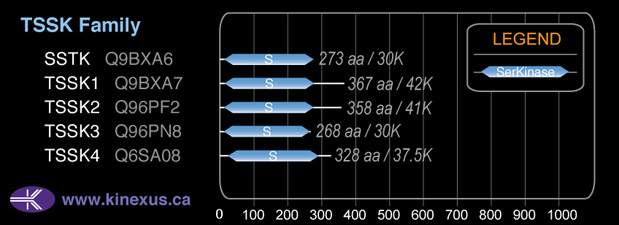
TSSK3
Full Name:
Testis-specific serine-threonine protein kinase 3
Alias:
- EC 2.7.11.1
- SPOGA3
- ST2C
- STK22C
- STK22C
Classification
Type:
Protein-serine/threonine kinase
Group:
CAMK
Family:
TSSK
SubFamily:
NA

Structure
Mol. Mass (Da):
30,102
# Amino Acids:
268
# mRNA Isoforms:
1
mRNA Isoforms:
30,102 Da (268 AA; Q96PN8)
4D Structure:
NA
1D Structure:
Subfamily Alignment
Domain Distribution:
| Start | End | Domain |
|---|---|---|
| 10 | 265 | Pkinase |
Kinexus Products
Click on entries below for direct links to relevant products from Kinexus for this protein kinase.
hiddentext
Post-translation Modifications
For detailed information on phosphorylation of this kinase go to PhosphoNET
Acetylated:
K112.
Serine phosphorylated:
S166+, S255.
Threonine phosphorylated:
T64, T168+.
Ubiquitinated:
K23, K31.
Distribution
Based on gene microarray analysis from the NCBI
Human Tissue Distribution
% Max Expression:
Mean Expression:
Number of Samples:
Standard Deviation:
% Max Expression:
Mean Expression:
Number of Samples:
Standard Deviation:
 53
53
1063
15
770
 0.3
0.3
6
5
4
 -
-
-
-
-
 0.4
0.4
8
53
6
 16
16
328
20
206
 0.2
0.2
5
18
5
 0.3
0.3
6
23
5
 0.7
0.7
14
7
10
 0.4
0.4
8
3
4
 1
1
21
31
17
 0.4
0.4
8
7
8
 42
42
843
19
677
 -
-
-
-
-
 0.3
0.3
7
3
3
 0.6
0.6
13
7
15
 0.2
0.2
5
10
3
 0.3
0.3
7
165
6
 0.3
0.3
7
3
5
 0.6
0.6
12
21
9
 16
16
320
54
168
 0.3
0.3
7
7
4
 0.3
0.3
7
7
4
 -
-
-
-
-
 15
15
294
3
23
 0.3
0.3
6
7
4
 37
37
749
35
646
 0.2
0.2
5
3
2
 0.1
0.1
2
3
1
 0.3
0.3
6
3
2
 2
2
43
14
60
 26
26
522
12
45
 39
39
784
22
1683
 0.1
0.1
2
24
0
 38
38
760
52
678
 100
100
2005
35
2167
Evolution
Species Conservation
PhosphoNET % Identity:
PhosphoNET % Similarity:
Homologene %
Identity:
PhosphoNET % Identity:
PhosphoNET % Similarity:
Homologene %
Identity:
 100
100
100
100 99.6
99.6
99.6
100 99.3
99.3
99.6
99 -
-
-
97 -
-
-
95 97
97
98.1
97 -
-
-
- 97.8
97.8
98.5
98 97.4
97.4
98.5
97 -
-
-
- 39.2
39.2
56.5
- 77.6
77.6
87.7
78 -
-
-
- -
-
-
- -
-
-
- -
-
-
- 38
38
56.8
- -
-
-
- -
-
-
- -
-
-
- -
-
-
- -
-
-
- -
-
-
- -
-
-
- -
-
-
-
For a wider analysis go to PhosphoNET Evolution in PhosphoNET
Regulation
Activation:
Activated by phosphorylation on Thr-168, potentially by autophosphorylation.
Inhibition:
NA
Synthesis:
NA
Degradation:
NA
Known Upstream Kinases
For further details on these substrates click on the Substrate Short Name or UniProt ID. Phosphosite Location is hyperlinked to PhosphoNET
predictions.
Based on in vitro and/or in vivo phosphorylation data
| Kinase Short Name | UniProt ID (Human) | Phosphosite Location | Phosphosite Sequence | Effect of Phosphorylation |
|---|
Known Downstream Substrates
For further details on these substrates click on the Substrate Short Name or UniProt ID. Phosphosite Location is hyperlinked to PhosphoNET
predictions.
Based on in vitro and/or in vivo phosphorylation data
| Substrate Short Name | UniProt ID (Human) | Phosphosite Location | Phosphosite Sequence | Effect of Phosphorylation |
|---|
Protein Kinase Specificity
Matrix of observed frequency (%) of amino acids in aligned protein substrate phosphosites
Matrix Type:
Predicted from the application of the Kinexus Kinase Substrate Predictor Version 2.0 algorithm, which was trained with over 10,000 kinase-protein substrate pairs and 8,000 kinase-peptide substrate pairs.
Domain #:
1
Disease Linkage
Gene Expression in Cancers:
The COSMIC website notes an up-regulated expression score for TSSK3 in diverse human cancers of 524, which is 1.1-fold of the average score of 462 for the human protein kinases. The down-regulated expression score of 23 for this protein kinase in human cancers was 0.4-fold of the average score of 60 for the human protein kinases.
Mutagenesis Experiments:
Insertional mutagenesis studies in mice have not yet revealed a role for this protein kinase in mouse cancer oncogenesis.
Mutation Rate in All Cancers:
Percent mutation rates per 100 amino acids length in human cancers: 0.07 % in 24726 diverse cancer specimens. This rate is only -5 % lower and is very similar to the average rate of 0.075 % calculated for human protein kinases in general.
Mutation Rate in Specific Cancers:
Highest percent mutation rates per 100 amino acids length in human cancers: 0.57 % in 65 Meninges cancers tested; 0.44 % in 1270 large intestine cancers tested; 0.38 % in 589 stomach cancers tested; 0.26 % in 864 skin cancers tested; 0.19 % in 603 endometrium cancers tested; 0.11 % in 710 oesophagus cancers tested; 0.07 % in 548 urinary tract cancers tested; 0.07 % in 1634 lung cancers tested; 0.06 % in 2009 haematopoietic and lymphoid cancers tested; 0.06 % in 1316 breast cancers tested; 0.04 % in 942 upper aerodigestive tract cancers tested; 0.04 % in 2082 central nervous system cancers tested; 0.02 % in 1512 liver cancers tested; 0 % in 1276 kidney cancers tested.
Frequency of Mutated Sites:
None > 3 in 20,009 cancer specimens
Comments:
Only 6 deletions, 1 insertion, and no complex mutations are noted on the COSMIC website.