
Nomenclature
Short Name:
ZC3
Full Name:
Mitogen-activated protein kinase kinase kinase kinase 6
Alias:
- B55
- MINK1
- Misshapen/NIK-related kinase
- Misshapen-like kinase 1
- YSK2
- EC 2.7.11.1
- Kinase MINK
- MAP4K6
- MINK
Classification
Type:
Protein-serine/threonine kinase
Group:
STE
Family:
STE20
SubFamily:
MSN

Structure
Mol. Mass (Da):
149822
# Amino Acids:
1332
# mRNA Isoforms:
5
mRNA Isoforms:
149,822 Da (1332 AA; Q8N4C8); 147,653 Da (1312 AA; Q8N4C8-4); 146,711 Da (1303 AA; Q8N4C8-3); 145,806 Da (1295 AA; Q8N4C8-2); 143,637 Da (1275 AA; Q8N4C8-5)
4D Structure:
NA
1D Structure:
Subfamily Alignment
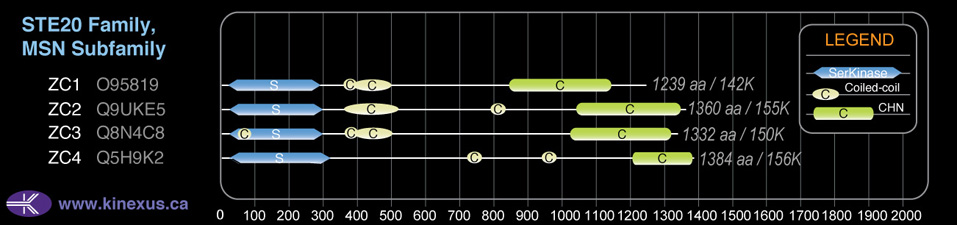
Domain Distribution:
| Start | End | Domain |
|---|---|---|
| 25 | 289 | Pkinase |
| 56 | 76 | Coiled-coil |
| 358 | 378 | Coiled-coil |
| 391 | 496 | Coiled-coil |
| 1019 | 1306 | CNH |
Post-translation Modifications
For detailed information on phosphorylation of this kinase go to PhosphoNET
Acetylated:
K590.
Methylated:
R509.
Serine phosphorylated:
S16, S175+, S324, S326, S332, S478, S535, S601, S641, S673, S674, S699, S701, S732, S733, S747, S754, S763, S772, S773, S777, S778, S782, S903, S916, S918, S927, S939, S1088, S1317.
Threonine phosphorylated:
T59, T181+, T187+, T191-, T280, T565, T629, T644, T907, T920, T1008, T1323.
Tyrosine phosphorylated:
Y36, Y86, Y193-, Y475, Y505, Y507, Y592, Y706, Y906, Y937, Y960, Y987, Y1320.
Ubiquitinated:
K1103, K1291.
Distribution
Based on gene microarray analysis from the NCBI
Human Tissue Distribution
% Max Expression:
Mean Expression:
Number of Samples:
Standard Deviation:
% Max Expression:
Mean Expression:
Number of Samples:
Standard Deviation:
 68
68
721
58
838
 9
9
99
25
86
 24
24
251
32
273
 54
54
571
187
619
 79
79
841
47
683
 15
15
161
165
233
 23
23
250
55
434
 73
73
784
86
1305
 73
73
774
31
603
 15
15
156
155
153
 17
17
183
63
336
 86
86
914
297
699
 22
22
230
76
271
 14
14
150
18
203
 11
11
114
23
128
 19
19
208
29
185
 41
41
441
163
2669
 16
16
170
45
173
 9
9
93
173
74
 63
63
670
215
652
 49
49
522
47
612
 21
21
228
55
233
 28
28
297
36
304
 18
18
189
45
227
 19
19
201
47
212
 94
94
1006
121
1723
 20
20
215
79
259
 19
19
203
45
183
 20
20
218
45
223
 26
26
279
56
173
 40
40
430
36
393
 93
93
987
66
858
 15
15
155
106
269
 100
100
1067
104
732
 8
8
81
70
86
Evolution
Species Conservation
PhosphoNET % Identity:
PhosphoNET % Similarity:
Homologene %
Identity:
PhosphoNET % Identity:
PhosphoNET % Similarity:
Homologene %
Identity:
 100
100
100
100 99.4
99.4
99.6
100 -
-
-
98 -
-
-
97.5 -
-
-
97 -
-
-
95 -
-
-
- 94.4
94.4
95.8
97 24.1
24.1
38.9
97 -
-
-
- -
-
-
- -
-
-
- -
-
-
86 -
-
-
- -
-
-
- -
-
-
- -
-
-
- 46.1
46.1
59
43 -
-
-
- -
-
-
- -
-
-
- -
-
-
- -
-
-
- -
-
-
- -
-
-
-
For a wider analysis go to PhosphoNET Evolution in PhosphoNET
Binding Proteins
Examples of known interacting proteins
hiddentext
| No. | Name – UniProt ID |
|---|---|
| 1 | NCK1 - P16333 |
| 2 | RAP2A - P10114 |
| 3 | CALM1 - P62158 |
| 4 | MAP1B - P46821 |
| 5 | SPTBN2 - O15020 |
| 6 | NEFM - P07197 |
| 7 | YWHAZ - P63104 |
Regulation
Activation:
NA
Inhibition:
NA
Synthesis:
NA
Degradation:
NA
Known Upstream Kinases
For further details on these substrates click on the Substrate Short Name or UniProt ID. Phosphosite Location is hyperlinked to PhosphoNET
predictions.
Based on in vitro and/or in vivo phosphorylation data
| Kinase Short Name | UniProt ID (Human) | Phosphosite Location | Phosphosite Sequence | Effect of Phosphorylation |
|---|
Known Downstream Substrates
For further details on these substrates click on the Substrate Short Name or UniProt ID. Phosphosite Location is hyperlinked to PhosphoNET
predictions.
Based on in vitro and/or in vivo phosphorylation data
| Substrate Short Name | UniProt ID (Human) | Phosphosite Location | Phosphosite Sequence | Effect of Phosphorylation |
|---|
| ZC3 (MINK) | Q8N4C8 | T187 | RTVGRRNTFIGTPYW | + |
| ZC3 (MINK) | Q8N4C8 | T191 | RRNTFIGTPYWMAPE | - |
| ZC3 (MINK) | Q8N4C8 | Y193 | NTFIGTPYWMAPEVI | - |
Protein Kinase Specificity
Matrix of observed frequency (%) of amino acids in aligned protein substrate phosphosites
Matrix Type:
Predicted from the application of the Kinexus Kinase Substrate Predictor Version 2.0 algorithm, which was trained with over 10,000 kinase-protein substrate pairs and 8,000 kinase-peptide substrate pairs.
Domain #:
1
Inhibitors
For further details on these inhibitors click on the Compound Name and enter it into DrugKiNET or click on the ID's
Based on in vitro and/or in vivo phosphorylation data
| Compound Name | KD, Ki or IC50 (nM) | PubChem ID | ChEMBL ID | PubMed ID |
|---|
Disease Linkage
Comments:
ZC3 may be a tumour requiring protein (TRP), since it undergoes fewer mutations than the typical protein in cancer cells.
Gene Expression in Cancers:
TranscriptoNET (www.transcriptonet.ca) analysis with mRNA expression data retrieved from the National Center for Biotechnology Information's Gene Expression Omnibus (GEO) database, which was normalized against 60 abundantly and commonly found proteins, indicated altered expression for this protein kinase as shown here as the percent change from normal tissue controls (%CFC) as supported with the Student T-test in the following types of human cancers: Classical Hodgkin lymphomas (%CFC= +64, p<0.013); Large B-cell lymphomas (%CFC= +67, p<0.024); Oral squamous cell carcinomas (OSCC) (%CFC= -49, p<0.011); Ovary adenocarcinomas (%CFC= +90, p<0.051); and Skin melanomas - malignant (%CFC= -57, p<0.045).
Mutagenesis Experiments:
Insertional mutagenesis studies in mice have not yet revealed a role for this protein kinase in mouse cancer oncogenesis.
Mutation Rate in All Cancers:
Percent mutation rates per 100 amino acids length in human cancers: 0.04 % in 24434 diverse cancer specimens. This rate is -41 % lower than the average rate of 0.075 % calculated for human protein kinases in general.
Mutation Rate in Specific Cancers:
Highest percent mutation rates per 100 amino acids length in human cancers: 0.23 % in 1052 large intestine cancers tested; 0.22 % in 805 skin cancers tested; 0.15 % in 602 endometrium cancers tested; 0.15 % in 555 stomach cancers tested.
Frequency of Mutated Sites:
Most frequent mutations with the number of reports indicated in brackets: V298G (5).
Comments:
Only 5 deletions, 2 insertions and no complex mutations are noted on the COSMIC website.