
Nomenclature
Short Name:
CK1d
Full Name:
Casein kinase I, delta isoform
Alias:
- Casein kinase 1, delta
- CK1-delta
- KC1D
- Kinase CK1-delta
- CKId
- CSNK1D
- EC 2.7.11.1
- HCKID
Classification
Type:
Protein-serine/threonine kinase
Group:
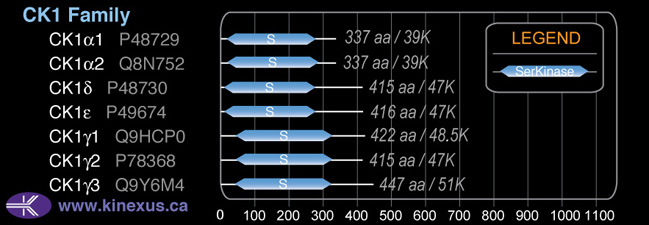
CK1
Family:
CK1
SubFamily:
NA

Specific Links
Structure
Mol. Mass (Da):
47,330
# Amino Acids:
415
# mRNA Isoforms:
2
mRNA Isoforms:
47,330 Da (415 AA; P48730); 46,832 Da (409 AA; P48730-2)
4D Structure:
Monomer. Component of the circadian core oscillator, which includes the CRY proteins, CLOCK, or NPAS2, BMAL1 or BMAL2, CSNK1D and/or CSNK1E, TIMELESS and the PER proteins. Interacts directly with PER1 and PER2 which may lead to their degradation. Interacts with DBNDD2
1D Structure:
3D Image (rendered using PV Viewer):
PDB ID
Subfamily Alignment
Domain Distribution:
| Start | End | Domain |
|---|---|---|
| 9 | 269 | Pkinase |
Kinexus Products
Click on entries below for direct links to relevant products from Kinexus for this protein kinase.
hiddentext
Post-translation Modifications
For detailed information on phosphorylation of this kinase go to PhosphoNET
Acetylated:
K242.
Serine phosphorylated:
S328, S331, S350, S356, S361, S370-, S382, S383, S384, S396, S398, S406, S407, S411.
Threonine phosphorylated:
T329, T344, T347, T349, T355, T387.
Ubiquitinated:
K122, K130, K140, K263.
Distribution
Based on gene microarray analysis from the NCBI
Human Tissue Distribution
% Max Expression:
Mean Expression:
Number of Samples:
Standard Deviation:
% Max Expression:
Mean Expression:
Number of Samples:
Standard Deviation:
 25
25
1163
29
1159
 6
6
281
17
174
 9
9
433
10
302
 16
16
756
97
1229
 23
23
1062
25
803
 2
2
104
74
45
 11
11
513
35
626
 26
26
1226
46
2087
 17
17
784
17
536
 5
5
252
87
172
 4
4
198
33
122
 20
20
933
194
758
 5
5
257
32
225
 5
5
218
15
194
 7
7
316
27
254
 7
7
322
16
156
 8
8
359
203
187
 5
5
246
21
208
 4
4
192
98
139
 16
16
736
109
719
 8
8
356
25
294
 8
8
382
29
295
 9
9
419
20
315
 6
6
298
21
171
 8
8
354
25
293
 24
24
1120
61
1278
 5
5
237
35
198
 7
7
345
21
276
 7
7
352
21
277
 0.6
0.6
29
28
10
 19
19
905
24
690
 100
100
4718
36
8814
 7
7
322
63
299
 23
23
1103
57
836
 24
24
1111
44
1780
Evolution
Species Conservation
PhosphoNET % Identity:
PhosphoNET % Similarity:
Homologene %
Identity:
PhosphoNET % Identity:
PhosphoNET % Similarity:
Homologene %
Identity:
 100
100
100
100 94.4
94.4
95.3
100 76.1
76.1
76.4
- -
-
-
- -
-
-
- 90.4
90.4
91.6
98.5 -
-
-
- 99.8
99.8
100
100 56.9
56.9
65.3
100 -
-
-
- -
-
-
- 83.9
83.9
88.9
96 96.6
96.6
97.8
97 91.1
91.1
94.7
95 -
-
-
- 62.5
62.5
72
80 66.8
66.8
77.1
- -
-
-
- 71
71
78.8
- -
-
-
- -
-
-
- -
-
-
61 56.7
56.7
69.6
73 47.8
47.8
63.8
66 -
-
-
78
For a wider analysis go to PhosphoNET Evolution in PhosphoNET
Regulation
Activation:
Heparin can stimulate CK1 activity towards certain substrates.
Inhibition:
NA
Synthesis:
NA
Degradation:
NA
Known Upstream Kinases
For further details on these substrates click on the Substrate Short Name or UniProt ID. Phosphosite Location is hyperlinked to PhosphoNET
predictions.
Based on in vitro and/or in vivo phosphorylation data
| Kinase Short Name | UniProt ID (Human) | Phosphosite Location | Phosphosite Sequence | Effect of Phosphorylation |
|---|
Known Downstream Substrates
For further details on these substrates click on the Substrate Short Name or UniProt ID. Phosphosite Location is hyperlinked to PhosphoNET
predictions.
Based on in vitro and/or in vivo phosphorylation data
| Substrate Short Name | UniProt ID (Human) | Phosphosite Location | Phosphosite Sequence | Effect of Phosphorylation |
|---|
| BACE | P56817 | S498 | DDFADDISLLK____ | ? |
| CDH1 | P12830 | S844 | GSGSEAASLSSLNSS | - |
| CTNNB1 | P35222 | S45 | GATTTAPSLSGKGNP | + |
| FOXO1A | Q12778 | S322 | PRTSSNASTISGRLS | - |
| FOXO1A | Q12778 | S325 | SSNASTISGRLSPIM | - |
| KIR3DL1 | P43629 | S385 | AGNRTANSEDSDEQD | + |
| KIR3DL1 | P43629 | S388 | RTANSEDSDEQDPEE | + |
| MBP | P02686 | S244 | QGKGRGLSLSRFSWG | |
| MDM2 | Q00987 | S240 | GDWLDQDSVSDQFSV | + |
| MDM2 | Q00987 | S242 | WLDQDSVSDQFSVEF | + |
| MDM2 | Q00987 | S246 | DSVSDQFSVEFEVES | + |
| NCOA3 (SRC-3) | Q9Y6Q9 | S601 | SDKESKESSVEGAEN | + |
| p53 | P04637 | S20 | PLSQETFSDLWKLLP | + |
| p53 | P04637 | S6 | __MEEPQSDPSVEPP | + |
| p53 | P04637 | S9 | EEPQSDPSVEPPLSQ | |
| p53 | P04637 | T18 | EPPLSQETFSDLWKL | + |
| Per2 | O15055 | S1236 | SLGLSEVSDTKEDEN | |
| Per2 | O15055 | S527 | GNKTKNRSHYSHESG | |
| Per2 | O15055 | S530 | TKNRSHYSHESGEQK | |
| Per2 | O15055 | S533 | RSHYSHESGEQKKKS | |
| Per2 | O15055 | S540 | SGEQKKKSVTEMQTN | |
| Per2 | O15055 | S544 | ASVAEMQSSPPAQVK | |
| Per2 | O15055 | S627 | DKRKATVSPGPHAGE | |
| Per2 | O15055 | S696 | EMVEDAASGPESLDC | |
| Per2 | O15055 | S700 | DAASGPESLDCLAGP | |
| Per2 | O15055 | S766 | HYYLQERSKGQPSER | |
| Per2 | O15055 | S771 | ERSKGQPSERTAPGL | |
| Per2 | O15055 | S807 | KRVKPRDSSESTGSG | |
| Per2 | O15055 | S808 | RVKPRDSSESTGSGG | |
| Per2 | O15055 | S810 | KPRDSSESTGSGGPV | |
| Per2 | O15055 | S813 | DSSESTGSGGPVSAR | |
| Per2 | O15055 | S818 | TGSGGPVSARPPLVG | |
| Per2 | O15055 | S93 | AKSEHNPSTSGCSSD | |
| Per2 | O15055 | S939 | PSHPTLTSEMASASQ | |
| Per2 | O15055 | S945 | TSEMASASQPEFPSR | |
| Per2 | O15055 | S977 | PSAMGRASPPLFQSR | |
| Per2 | O15055 | S986 | PLFQSRSSSPLQLNL | |
| Per2 | O15055 | S987 | LFQSRSSSPLQLNLL | |
| Per2 | O15055 | T1004 | EEAPEGGTGAMGTTG | |
| Per2 | O15055 | T1237 | PSPGLCDTSEAKEEE | |
| Per2 | O15055 | T625 | SSDKRKATVSPGPHA | |
| Per2 | O15055 | T781 | TAPGLRNTSGIDSPW | |
| Per2 | O15055 | T811 | PRDSSESTGSGGPVS | |
| Per2 | O15055 | T864 | PVFPAPGTVAAPPAP | |
| Per2 | O15055 | T94 | KSEHNPSTSGCSSDQ | |
| PSEN2 | P49810 | S327 | DPEMEEDSYDSFGEP | + |
| PSEN2 | P49810 | S330 | MEEDSYDSFGEPSYP | + |
| Tau | P10636 | S518 | SGYSSPGSPGTPGSR | |
| Tau | P10636 | S712 | GAEIVYKSPVVSGDT | |
| Tau | P10636 | S720 | PVVSGDTSPRHLSNV | |
| Tau iso8 | P10636-8 | T205 | SSPGSPGTPGSRSRT |
Protein Kinase Specificity
Matrix of observed frequency (%) of amino acids in aligned protein substrate phosphosites
Matrix Type:
Experimentally derived from alignment of 71 known protein substrate phosphosites.
Domain #:
1
Inhibitors
For further details on these inhibitors click on the Compound Name and enter it into DrugKiNET or click on the ID's
Based on in vitro and/or in vivo phosphorylation data
| Compound Name | KD, Ki or IC50 (nM) | PubChem ID | ChEMBL ID | PubMed ID |
|---|
Disease Linkage
General Disease Association:
Neurological disorders
Specific Diseases (Non-cancerous):
Advanced sleep phase syndrome; Advanced sleep-phase syndrome, familial, 2; Familial advanced sleep phase syndrome 1
Comments:
Several loss-of-function mutations in the CSNK1D gene have been identified in ASPS patients, including a T44A substitution mutation, and a H46R substitution mutation. The T44A mutation occurs at a highly conserved residue that is found in the casein kinase 1 protein from Drosphila through mammals. Enzymatic anaylsis revealed that the T44A mutant CSNK1D protein displays significantly reduced kinase catalytic activity compared to the wildtype protein. Similarly, the H46R residue also occurs at a highly conserved residue and has been shown to reduce the kinase catalytic activity of the H46R mutant CSNK1D protein by 53% compared to the wildtype protein. Therefore, the ASPS phenotype is associated with a loss-of-function in the catalytic activity of the CSNK1D protein. In animal studies, Drosophila carrying the T44A mutation displayed lengthened circadian cycles. In constrast, mice carrying the same mutation display shortened circadian cycles and a similar phenotype to human ASPS. In addition, overexpression of the CSNK1D gene in the forebrain and striatum of mice results in hyperactivity, decreased anxiety, increased impulsivity, and defective nesting behaviours, potential due to abnormal circadian rythyms. Furthermore, these mice showed paradoxical responses to the injection of dopamine receptor agonists into the brain. In addition, CSNK1D overexpression is associated with decreased expression of the dopamine receptors D1 and D2 in the affected brain regions, indicating a role for the protein in the modulation of dopaminergic signalling in the brain. Advanced sleep phase syndrome (ASPS) is a sleep disorder characterized by the abnormal alteration of the circadian rhythym. Symptoms include falling asleep in the early evening (6:00-8:00 pm) and waking up early in the morning (e.g. 3:00 am). ASPS is a rare disorder that appears to affect men and women equally with a strong genetic association.
Gene Expression in Cancers:
TranscriptoNET (www.transcriptonet.ca) analysis with mRNA expression data retrieved from the National Center for Biotechnology Information's Gene Expression Omnibus (GEO) database, which was normalized against 60 abundantly and commonly found proteins, indicated altered expression for this protein kinase as shown here as the percent change from normal tissue controls (%CFC) as supported with the Student T-test in the following types of human cancers: Bladder carcinomas (%CFC= +96, p<0.0001); Large B-cell lymphomas (%CFC= +54, p<0.018); Large B-cell lymphomas (%CFC= +54, p<0.023); Malignant pleural mesotheliomas (MPM) tumours (%CFC= +57, p<0.028); and Skin melanomas - malignant (%CFC= +61, p<0.008).
Mutagenesis Experiments:
Insertional mutagenesis studies in mice have not yet revealed a role for this protein kinase in mouse cancer oncogenesis.
Mutation Rate in All Cancers:
Percent mutation rates per 100 amino acids length in human cancers: 0.07 % in 24440 diverse cancer specimens. This rate is only -1 % lower and is very similar to the average rate of 0.075 % calculated for human protein kinases in general.
Mutation Rate in Specific Cancers:
Highest percent mutation rates per 100 amino acids length in human cancers: 0.51 % in 1270 large intestine cancers tested.
Frequency of Mutated Sites:
Most frequent mutations with the number of reports indicated in brackets: A36V (5), S97P (4).
Comments:
Only 3 deletions, no insertions or complex mutations.