
Nomenclature
Short Name:
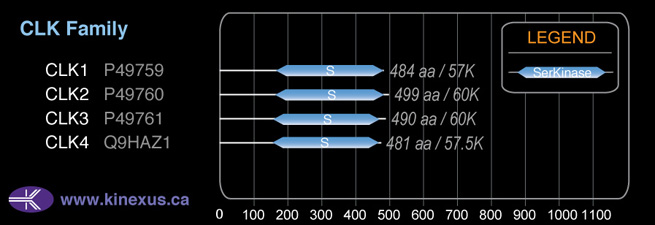
CLK2
Full Name:
Dual specificity protein kinase CLK2
Alias:
- CDC-like kinase 2
- Clk2
- EC 2.7.12.1
- Kinase CLK2
Classification
Type:
Protein-serine/threonine kinase
Group:
CMGC
Family:
CLK
SubFamily:
NA

Specific Links
Structure
Mol. Mass (Da):
60,090
# Amino Acids:
499
# mRNA Isoforms:
3
mRNA Isoforms:
60,090 Da (499 AA; P49760); 59,962 Da (498 AA; P49760-3); 17,569 Da (139 AA; P49760-2)
4D Structure:
NA
1D Structure:
3D Image (rendered using PV Viewer):
PDB ID
Subfamily Alignment
Domain Distribution:
| Start | End | Domain |
|---|---|---|
| 163 | 479 | Pkinase |
Kinexus Products
Click on entries below for direct links to relevant products from Kinexus for this protein kinase.
hiddentext
Post-translation Modifications
For detailed information on phosphorylation of this kinase go to PhosphoNET
Threonine phosphorylated:
T127+, T332+, T340+, T344-, T469.
Tyrosine phosphorylated:
Y7, Y51, Y59, Y69, Y82, Y91, Y95, Y99-, Y101, Y153+, Y347-, Y430.
Serine phosphorylated:
S9, S10, S14, S17+, S34+, S50, S55, S57, S58, S63, S64, S83, S98, S106, S142, S167, S330+, S343-, S402, S493, S498.
Distribution
Based on gene microarray analysis from the NCBI
Human Tissue Distribution
% Max Expression:
Mean Expression:
Number of Samples:
Standard Deviation:
% Max Expression:
Mean Expression:
Number of Samples:
Standard Deviation:
 90
90
1005
16
1143
 11
11
123
10
88
 46
46
512
13
751
 53
53
591
58
753
 83
83
928
14
769
 27
27
307
45
318
 33
33
374
19
557
 76
76
850
33
1297
 46
46
521
10
450
 16
16
176
56
142
 19
19
210
25
201
 62
62
692
117
701
 46
46
513
24
431
 7
7
77
9
69
 31
31
347
23
377
 17
17
193
8
67
 34
34
377
112
2320
 18
18
206
20
210
 8
8
95
55
86
 67
67
750
56
703
 18
18
207
22
184
 37
37
413
24
426
 36
36
404
22
315
 38
38
425
20
397
 38
38
427
22
402
 60
60
678
40
676
 52
52
581
27
1519
 23
23
263
20
275
 40
40
453
20
710
 9
9
103
14
20
 43
43
480
6
98
 100
100
1122
15
798
 56
56
631
57
802
 80
80
892
31
806
 38
38
430
22
341
Evolution
Species Conservation
PhosphoNET % Identity:
PhosphoNET % Similarity:
Homologene %
Identity:
PhosphoNET % Identity:
PhosphoNET % Similarity:
Homologene %
Identity:
 100
100
100
100 99.8
99.8
99.8
100 99.8
99.8
99.8
- -
-
-
99 -
-
-
99 51.3
51.3
62.4
98 91.6
91.6
91.8
- -
-
-
97 96.8
96.8
98.2
97 59.9
59.9
73.8
- -
-
-
- -
-
-
85 21.3
21.3
39.7
82 -
-
-
75 74.9
74.9
83.8
- -
-
-
73 37
37
48.4
- -
-
-
64 20.4
20.4
34.5
- -
-
-
- -
-
-
- -
-
-
- -
-
-
51 39.1
39.1
56.9
- 24.8
24.8
43.4
46
For a wider analysis go to PhosphoNET Evolution in PhosphoNET
Binding Proteins
Examples of known interacting proteins
hiddentext
| No. | Name – UniProt ID |
|---|---|
| 1 | YWHAG - P61981 |
Regulation
Activation:
NA
Inhibition:
NA
Synthesis:
NA
Degradation:
NA
Known Upstream Kinases
For further details on these substrates click on the Substrate Short Name or UniProt ID. Phosphosite Location is hyperlinked to PhosphoNET
predictions.
Based on in vitro and/or in vivo phosphorylation data
| Kinase Short Name | UniProt ID (Human) | Phosphosite Location | Phosphosite Sequence | Effect of Phosphorylation |
|---|
Known Downstream Substrates
For further details on these substrates click on the Substrate Short Name or UniProt ID. Phosphosite Location is hyperlinked to PhosphoNET
predictions.
Based on in vitro and/or in vivo phosphorylation data
| Substrate Short Name | UniProt ID (Human) | Phosphosite Location | Phosphosite Sequence | Effect of Phosphorylation |
|---|
Protein Kinase Specificity
Matrix of observed frequency (%) of amino acids in aligned protein substrate phosphosites
Matrix Type:
Experimentally derived from alignment of 5 known protein substrate phosphosites and 33 peptides phosphorylated by recombinant CLK2 in vitro tested in-house by Kinexus.
Domain #:
1
Inhibitors
For further details on these inhibitors click on the Compound Name and enter it into DrugKiNET or click on the ID's
Based on in vitro and/or in vivo phosphorylation data
| Compound Name | KD, Ki or IC50 (nM) | PubChem ID | ChEMBL ID | PubMed ID |
|---|
Disease Linkage
General Disease Association:
Neurological disorders
Specific Diseases (Non-cancerous):
Alzheimer's disease (AD)
Comments:
Alzheimer's disease (AD) is a neurodegenerative disease that causes progressive loss of memory, judgement, and other cognitive processes. The hallmark of AD pathology is the deposition of beta-amyloid plaques and tau tangles. These abnormalities are implicated in the disruption of cellular communication, oxidative cell damage, and eventual cell death. Multiple genes are thought to contribute to AD suceptibility along with epigenetic and environmental factors. Aggregation of hyperphosphorylated tau protein is a characteristic of AD pathology. Tau is a microtubule-associated protein that is expressed in different isoforms in the brain. Exon 10 of the tau gene encodes one of the four microtubule binding repeat domains found in the gene, therefore alternative splicing of the tau gene to either include (4 repeats) or exclude (3 repeats) exon 10 creates different isoforms of the tau protein. The ratio between the 3-repeat and 4-repeat isoform is tightly regulated in the normal nervous system and its distortion is correlated with neurodegenerative diseases and pathologies such as AD. Furthermore, post-mortem analysis of AD patient brain tissue revealed a significantly elevated proportion of tau mRNA with 4-repeats, indicating misregulation of tau splicing in AD. The CLK2 protein is one of several regulators of exon 10 splicing in the tau gene, therefore defects in the catalytic activity of CLK2 may contribute to the distorted ratio seen in AD resulting from the abnormal regulation of splicing.
Gene Expression in Cancers:
TranscriptoNET (www.transcriptonet.ca) analysis with mRNA expression data retrieved from the National Center for Biotechnology Information's Gene Expression Omnibus (GEO) database, which was normalized against 60 abundantly and commonly found proteins, indicated altered expression for this protein kinase as shown here as the percent change from normal tissue controls (%CFC) as supported with the Student T-test in the following types of human cancers: Barrett's esophagus epithelial metaplasia (%CFC= +55, p<0.036); Bladder carcinomas (%CFC= +56, p<0.006); Brain glioblastomas (%CFC= -96, p<0.006); Brain oligodendrogliomas (%CFC= -84, p<0.003); Large B-cell lymphomas (%CFC= +70, p<0.0006); Malignant pleural mesotheliomas (MPM) tumours (%CFC= +193, p<0.002); Ovary adenocarcinomas (%CFC= +67, p<0.009); and Skin melanomas - malignant (%CFC= +89, p<0.005). The COSMIC website notes an up-regulated expression score for CLK2 in diverse human cancers of 1208, which is 2.6-fold of the average score of 462 for the human protein kinases. The down-regulated expression score of 61 for this protein kinase in human cancers was 1-fold of the average score of 60 for the human protein kinases.
Mutagenesis Experiments:
Insertional mutagenesis studies in mice support a role for this protein kinase in mouse cancer oncogenesis.
Mutation Rate in All Cancers:
Percent mutation rates per 100 amino acids length in human cancers: 0.1 % in 24752 diverse cancer specimens. This rate is only 30 % higher than the average rate of 0.075 % calculated for human protein kinases in general.
Mutation Rate in Specific Cancers:
Highest percent mutation rates per 100 amino acids length in human cancers: 0.49 % in 864 skin cancers tested; 0.37 % in 589 stomach cancers tested; 0.36 % in 1270 large intestine cancers tested; 0.3 % in 603 endometrium cancers tested; 0.29 % in 273 cervix cancers tested; 0.21 % in 1512 liver cancers tested; 0.16 % in 1634 lung cancers tested.
Frequency of Mutated Sites:
Most frequent mutations with the number of reports indicated in brackets: P436L (5). These mutations are located in the kinase catalytic domain.
Comments:
Only 2 deletions, no insertions or complex mutations are noted on the COSMIC website.