
Nomenclature
Short Name:
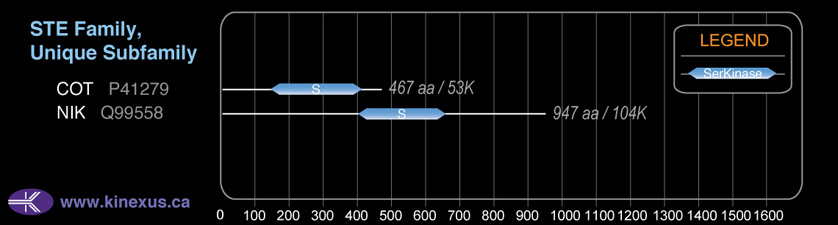
COT
Full Name:
Mitogen-activated protein kinase kinase kinase 8
Alias:
- EC 2.7.11.25
- FLJ10486
- TPL-2
- Tumor progression locus 2
- M3K8
- MAP3K8
- Tpl2
- TPL2
Classification
Type:
Protein-serine/threonine kinase
Group:
STE
Family:
STE-Unique
SubFamily:
NA

Specific Links
Structure
Mol. Mass (Da):
52,925
# Amino Acids:
467
# mRNA Isoforms:
2
mRNA Isoforms:
52,925 Da (467 AA; P41279); 49,620 Da (438 AA; P41279-2)
4D Structure:
Forms a ternary complex with NFKB1 and TNIP2.
1D Structure:
3D Image (rendered using PV Viewer):
PDB ID
Subfamily Alignment
Domain Distribution:
| Start | End | Domain |
|---|---|---|
| 138 | 387 | Pkinase |
Kinexus Products
Click on entries below for direct links to relevant products from Kinexus for this protein kinase.
hiddentext
Post-translation Modifications
For detailed information on phosphorylation of this kinase go to PhosphoNET
Serine phosphorylated:
S62+, S125, S141, S334, S368, S400+.
Threonine phosphorylated:
T290-.
Tyrosine phosphorylated:
Y136, Y153.
Distribution
Based on gene microarray analysis from the NCBI
Human Tissue Distribution
% Max Expression:
Mean Expression:
Number of Samples:
Standard Deviation:
% Max Expression:
Mean Expression:
Number of Samples:
Standard Deviation:
 50
50
1691
22
1723
 0.7
0.7
25
10
16
 2
2
57
9
38
 10
10
347
87
978
 22
22
755
24
519
 55
55
1846
54
4521
 6
6
193
33
322
 100
100
3357
38
5183
 10
10
329
10
325
 1.4
1.4
46
88
53
 1.3
1.3
42
24
40
 14
14
456
144
559
 1.5
1.5
49
20
59
 0.4
0.4
12
10
8
 0.9
0.9
29
21
32
 0.9
0.9
29
13
21
 3
3
100
258
601
 0.8
0.8
28
15
23
 0.7
0.7
22
75
22
 20
20
683
84
618
 1
1
34
22
29
 3
3
86
24
99
 0.8
0.8
27
18
34
 0.4
0.4
13
16
13
 1.4
1.4
48
21
67
 38
38
1279
59
1930
 2
2
68
23
77
 2
2
72
16
81
 1.2
1.2
39
17
44
 0.8
0.8
26
28
19
 24
24
800
18
549
 26
26
861
26
1655
 10
10
320
66
1043
 30
30
1020
57
856
 3
3
90
35
154
Evolution
Species Conservation
PhosphoNET % Identity:
PhosphoNET % Similarity:
Homologene %
Identity:
PhosphoNET % Identity:
PhosphoNET % Similarity:
Homologene %
Identity:
 100
100
100
100 81.3
81.3
81.5
100 -
-
-
- -
-
-
96 -
-
-
96 64.5
64.5
65.3
97 -
-
-
- 93.4
93.4
97.4
93 94
94
97.2
94 -
-
-
- 76.7
76.7
80.5
- 83.8
83.8
93
84 -
-
-
71 60.4
60.4
73.5
63 -
-
-
- -
-
-
- -
-
-
- -
-
-
- -
-
-
- -
-
-
- -
-
-
- -
-
-
- -
-
-
- -
-
-
- -
-
-
-
For a wider analysis go to PhosphoNET Evolution in PhosphoNET
Binding Proteins
Examples of known interacting proteins
hiddentext
| No. | Name – UniProt ID |
|---|---|
| 1 | TNIP2 - Q8NFZ5 |
| 2 | NFKB1 - P19838 |
| 3 | REL - Q04864 |
| 4 | RELA - Q04206 |
| 5 | MAP2K1 - Q02750 |
| 6 | AKT1 - P31749 |
| 7 | MAP2K4 - P45985 |
| 8 | LGALS3BP - Q08380 |
| 9 | ACTL6A - O96019 |
| 10 | CALM1 - P62158 |
| 11 | TUBA3C - Q13748 |
| 12 | HSPA8 - P11142 |
| 13 | HSPA9 - P38646 |
| 14 | TUBB4 - P04350 |
| 15 | HSPA5 - P11021 |
Regulation
Activation:
Phosphorylation of Ser-62 and Thr-290 increases phosphotransferase activity.
Inhibition:
NA
Synthesis:
NA
Degradation:
NA
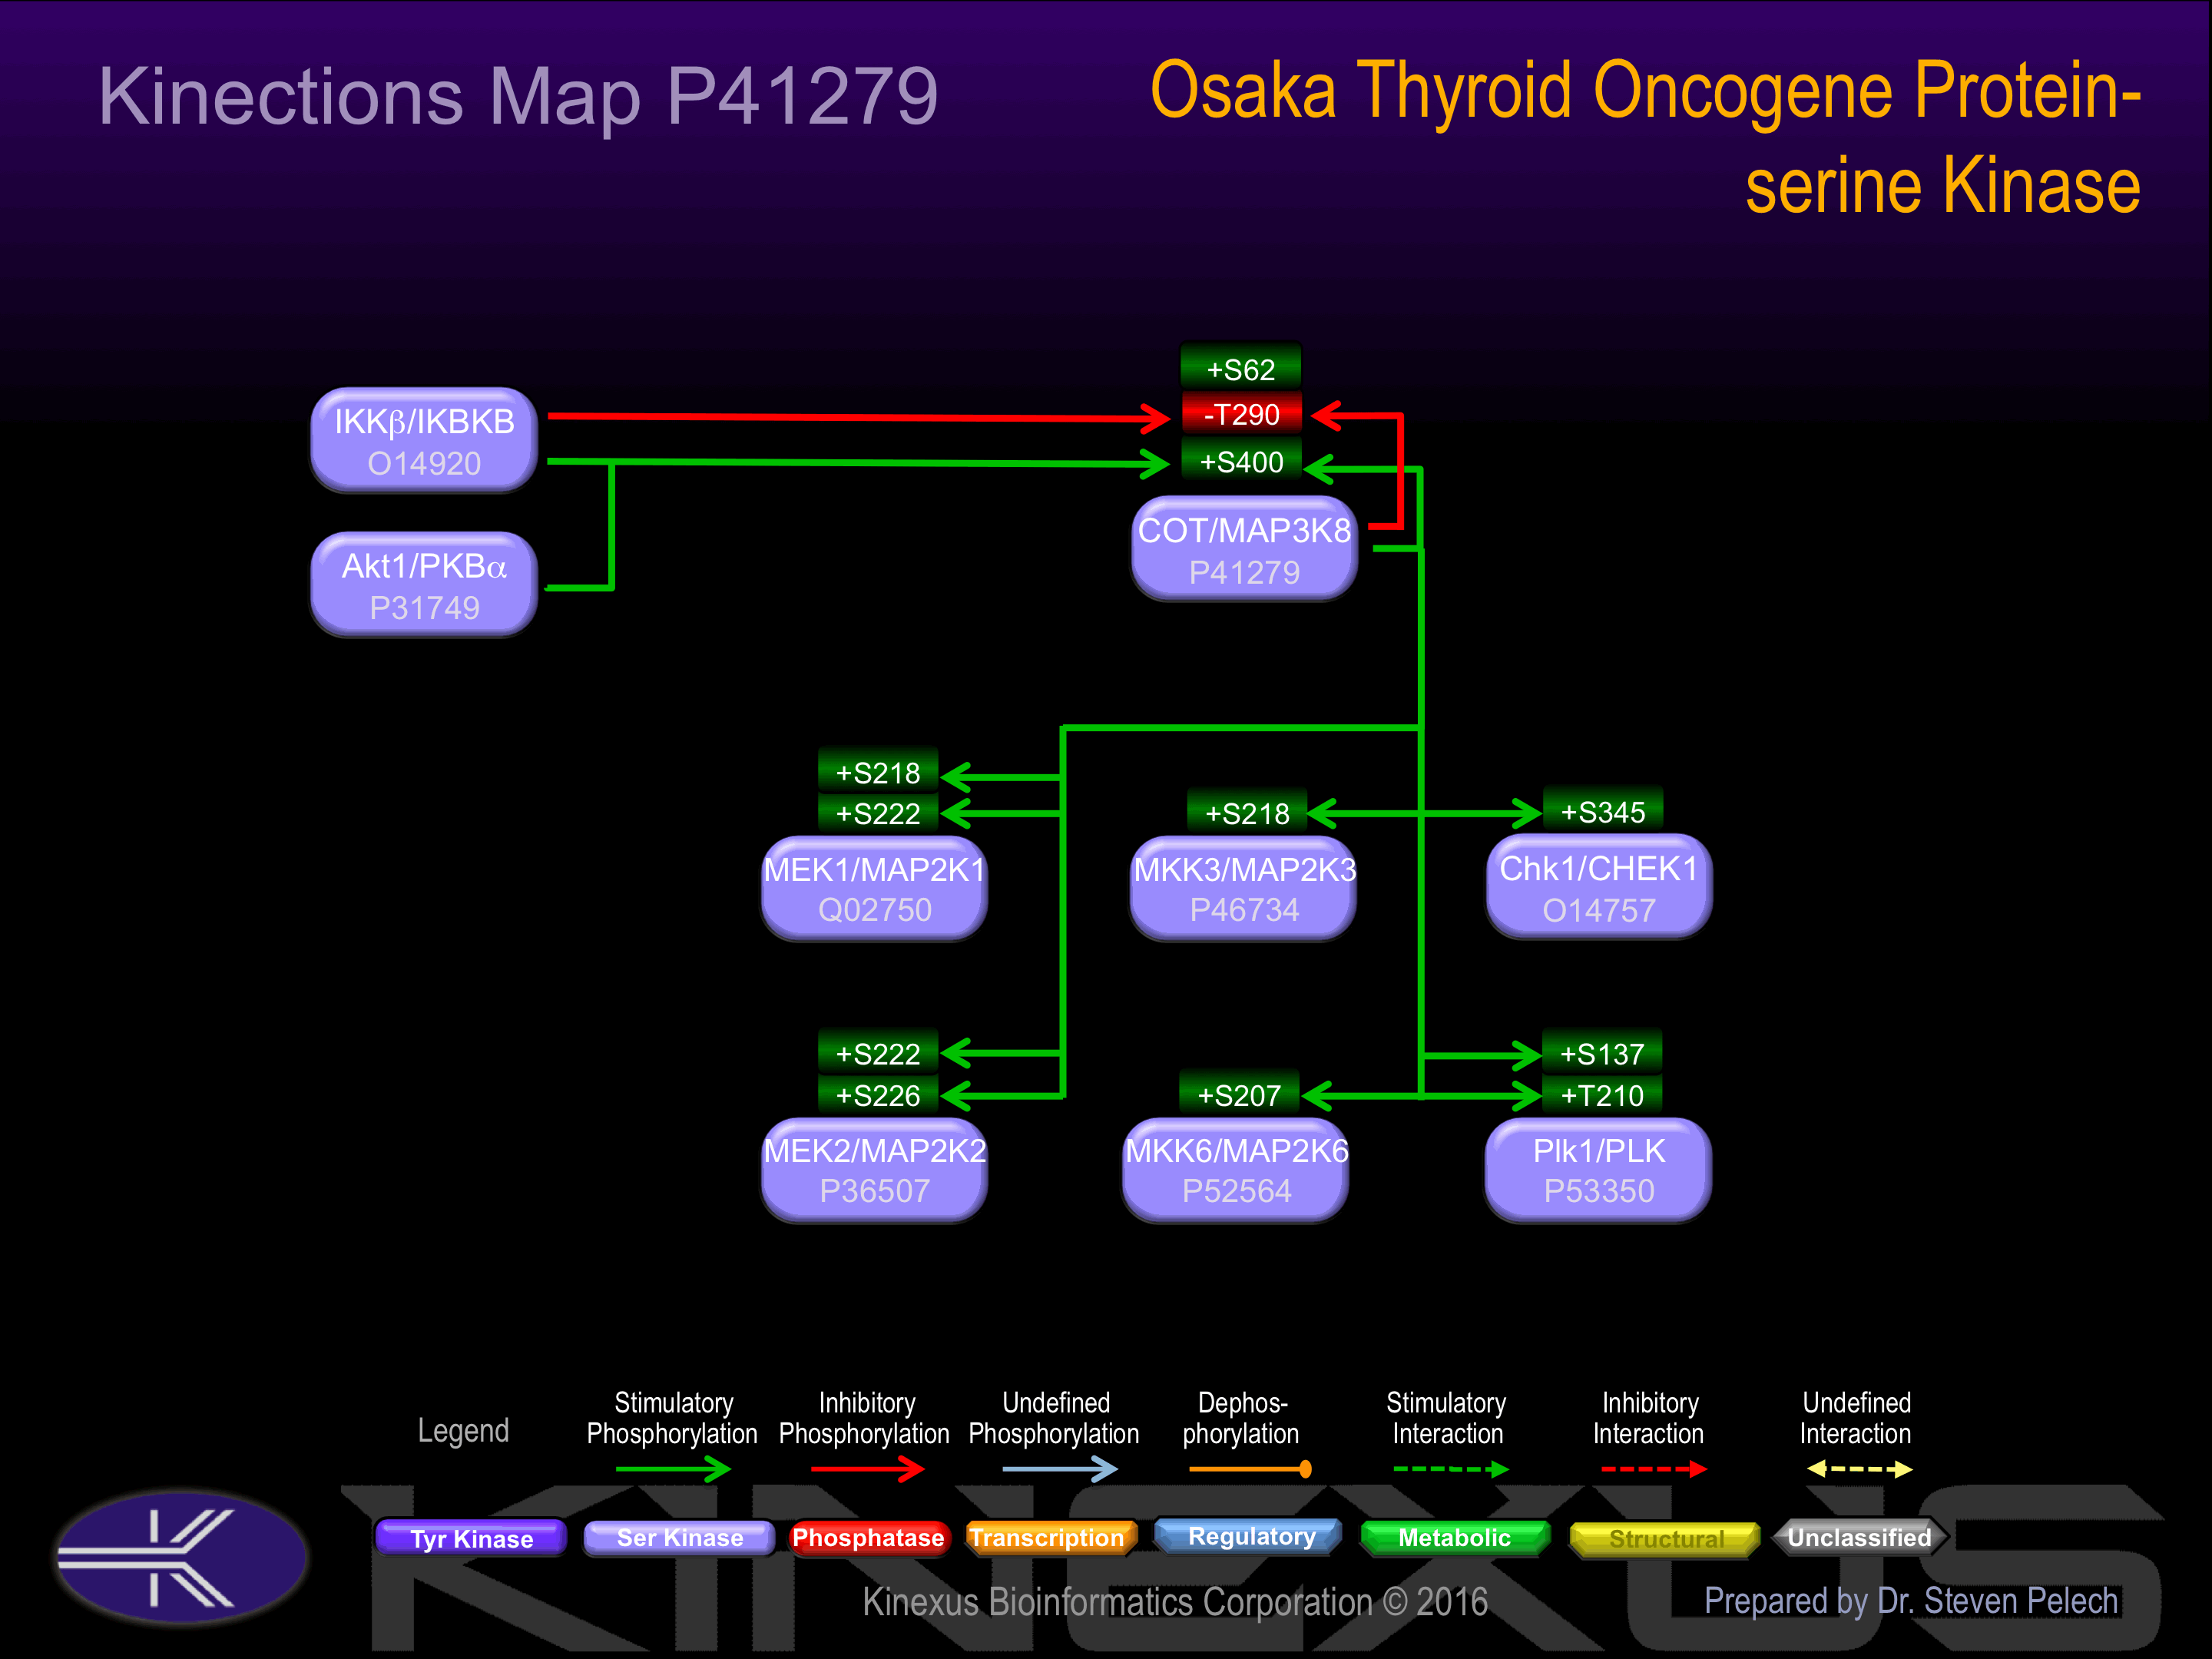
Known Upstream Kinases
For further details on these substrates click on the Substrate Short Name or UniProt ID. Phosphosite Location is hyperlinked to PhosphoNET
predictions.
Based on in vitro and/or in vivo phosphorylation data
| Kinase Short Name | UniProt ID (Human) | Phosphosite Location | Phosphosite Sequence | Effect of Phosphorylation |
|---|
Known Downstream Substrates
For further details on these substrates click on the Substrate Short Name or UniProt ID. Phosphosite Location is hyperlinked to PhosphoNET
predictions.
Based on in vitro and/or in vivo phosphorylation data
| Substrate Short Name | UniProt ID (Human) | Phosphosite Location | Phosphosite Sequence | Effect of Phosphorylation |
|---|
| Chk1 (CHEK1) | O14757 | S345 | LVQGISFSQPTCPDH | + |
| COT (MAP3K8) | P41279 | S400 | EDQPRCQSLDSALLE | + |
| COT (MAP3K8) | P41279 | T290 | FPKDLRGTEIYMSPE | - |
| MEK1 (MAP2K1) | Q02750 | S218 | VSGQLIDSMANSFVG | + |
| MEK1 (MAP2K1) | Q02750 | S222 | LIDSMANSFVGTRSY | + |
| MEK2 (MAP2K2) | P36507 | S222 | VSGQLIDSMANSFVG | + |
| MEK2 (MAP2K2) | P36507 | S226 | LIDSMANSFVGTRSY | + |
| MKK3 (MAP2K3, MEK3) | P46734 | S218 | ISGYLVDSVAKTMDA | + |
| MKK6 (MAP2K6, MEK6) | P52564 | S207 | ISGYLVDSVAKTIDA | + |
| Plk1 (PLK) | P53350 | S137 | LELCRRRSLLELHKR | + |
| Plk1 (PLK) | P53350 | T210 | YDGERKKTLCGTPNY | + |
Protein Kinase Specificity
Matrix of observed frequency (%) of amino acids in aligned protein substrate phosphosites
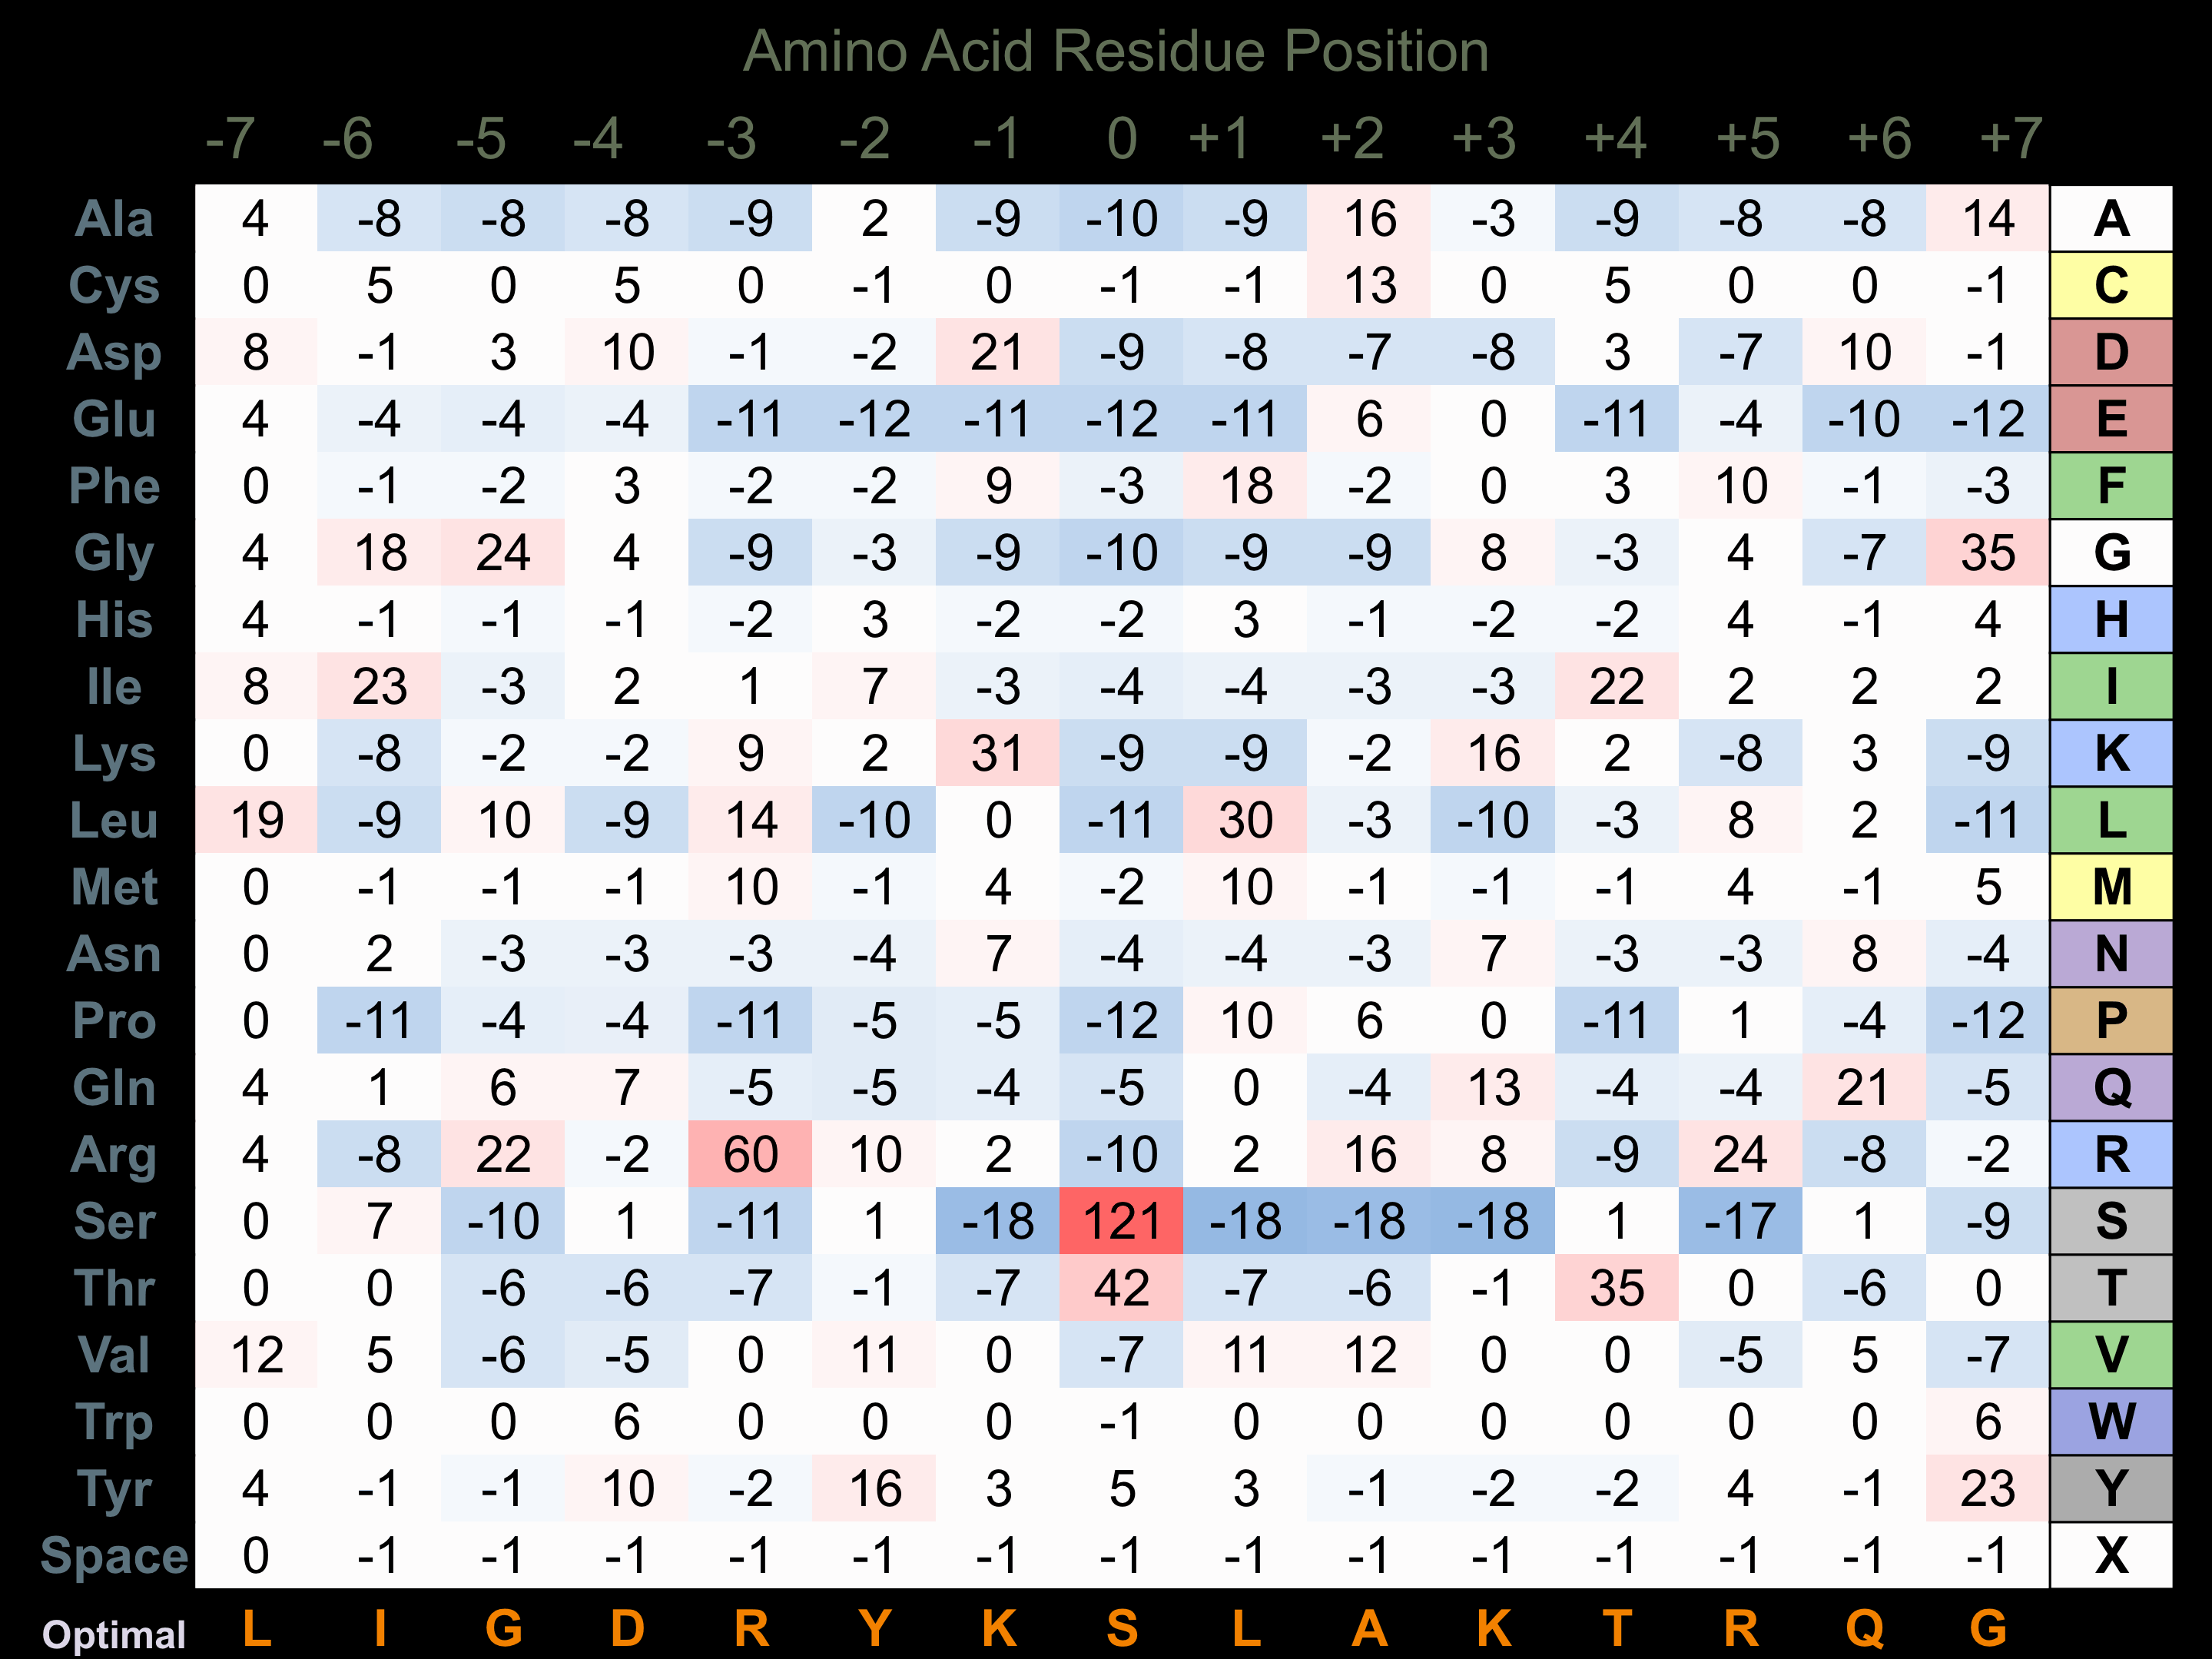
Matrix Type:
Experimentally derived from alignment of 19 known protein substrate phosphosites and 6 peptides phosphorylated by recombinant COT in vitro tested in-house by Kinexus.
Domain #:
1
Inhibitors
For further details on these inhibitors click on the Compound Name and enter it into DrugKiNET or click on the ID's
Based on in vitro and/or in vivo phosphorylation data
| Compound Name | KD, Ki or IC50 (nM) | PubChem ID | ChEMBL ID | PubMed ID |
|---|
| SureCN4772416 | IC50 = 2 nM | 11496376 | 371658 | 16165349 |
| Cyanoquinoline, 11 | IC50 = 12 nM | 17759555 | 436817 | 17848581 |
| MEK Inhibitor II | IC50 = 50 nM | 389898 | 404939 | 18077363 |
| BAY86-9766 | IC50 < 500 nM | 44182295 | 19706763 | |
| Momelotinib | IC50 < 750 nM | 25062766 | 19295546 | |
| A 443654 | IC50 = 1 µM | 10172943 | 379300 | 19465931 |
| Src Kinase Inhibitor I | IC50 > 1 µM | 1474853 | 97771 | 22037377 |
| SureCN10063060 | Ki > 1 µM | 52936621 | 21391610 | |
| WZ3146 | Kd > 1 µM | 44607360 | 20033049 | |
| WZ4002 | Kd > 1 µM | 44607530 | 20033049 | |
| SureCN4875304 | IC50 > 3.5 µM | 46871765 | 20472445 | |
| CHEMBL494221 | Ki > 4 µM | 44219633 | 494221 | 19414255 |
| Pyrimidylpyrrole, 11e | Ki > 4 µM | 11634725 | 583042 | 19827834 |
| SureCN12253834 | IC50 = 4 µM | 42625986 | 504547 | 19317452 |
Disease Linkage
General Disease Association:
Cancer
Specific Cancer Types:
Lung cancer (LC); Lung cancer (LC), Somatic
Comments:
COT appears to be an oncoprotein (OP), although it is not subject to a higher rate of mutation in human cancers than most proteins. The active form of the protein kinase normally acts to promote tumour cell proliferation.
Gene Expression in Cancers:
TranscriptoNET (www.transcriptonet.ca) analysis with mRNA expression data retrieved from the National Center for Biotechnology Information's Gene Expression Omnibus (GEO) database, which was normalized against 60 abundantly and commonly found proteins, indicated altered expression for this protein kinase as shown here as the percent change from normal tissue controls (%CFC) as supported with the Student T-test in the following types of human cancers: Bladder carcinomas (%CFC= -68, p<0.032); Brain glioblastomas (%CFC= -62, p<0.071); Breast epithelial carcinomas (%CFC= -70, p<0.064); Clear cell renal cell carcinomas (cRCC) stage I (%CFC= +482, p<0.029); Ovary adenocarcinomas (%CFC= -69, p<0.002); Prostate cancer - primary (%CFC= +281, p<0.0001); and Uterine leiomyomas from fibroids (%CFC= -48, p<0.065). The COSMIC website notes an up-regulated expression score for COT in diverse human cancers of 349, which is 0.8-fold of the average score of 462 for the human protein kinases. The down-regulated expression score of 0 for this protein kinase in human cancers was 100% lower than the average score of 60 for the human protein kinases.
Mutagenesis Experiments:
Insertional mutagenesis studies in mice have not yet revealed a role for this protein kinase in mouse cancer oncogenesis. Catalytic activity of COT can be abrogated with K167R or D270A mutations. IL-1 stimulated activity is decreased with S62A. This mutation can also inhibit IL-1 stimulated phosphorylation of T290 along with MEK phosphorylation when associated with A400. Full inhibition of IL-1 induced MEK phosphorylation and partial inhibition of autophosphorylation can occur with a T290A mutation. Partial inhibition of MEK phosphorylation and autophosphorylation can be achieved with a T290A or T290E mutation. Partial impairment of MEK phosphorylation induced by IL-1 has been observed with a S400A mutation. When COT is associated with A62, a complete loss of T290 and MEK phosphorylation occurs with a S400A mutation.
Mutation Rate in All Cancers:
Percent mutation rates per 100 amino acids length in human cancers: 0.07 % in 25491 diverse cancer specimens. This rate is only -8 % lower and is very similar to the average rate of 0.075 % calculated for human protein kinases in general.
Mutation Rate in Specific Cancers:
Highest percent mutation rates per 100 amino acids length in human cancers: 0.43 % in 602 endometrium cancers tested; 0.37 % in 1093 large intestine cancers tested; 0.17 % in 1226 kidney cancers tested.
Frequency of Mutated Sites:
Most frequent mutations with the number of reports indicated in brackets: P296S (9). These are located in the kinase catalytic domain.
Comments:
Only 1 deletion and 2 insertions and no complex mutations are noted on the COSMIC website.