Nomenclature
Short Name:
DDR2
Full Name:
Discoidin domain receptor-tyrosine kinase-2
Alias:
- Discoidin domain receptor 2
- Discoidin domain receptor tyrosine kinase 2
- Receptor protein-tyrosine kinase TKT
- TKT
- TYRO10
- Tyrosine-protein kinase TYRO 10
- EC 2.7.1.112
- EC 2.7.10.1
- Neurotrophic tyrosine kinase, receptor-related 3
- NTRKR3
Classification
Type:
Protein-tyrosine kinase
Group:
TK
Family:
DDR
SubFamily:
NA
Specific Links
Structure
Mol. Mass (Da):
96736
# Amino Acids:
855
# mRNA Isoforms:
1
mRNA Isoforms:
96,736 Da (855 AA; Q16832)
4D Structure:
NA
1D Structure:
3D Image (rendered using PV Viewer):
PDB ID
Subfamily Alignment

Domain Distribution:
| Start | End | Domain |
|---|---|---|
| 1 | 23 | signal_peptide |
| 30 | 185 | FA58C |
| 399 | 421 | TMD |
| 563 | 849 | TyrKc |
| 563 | 851 | Pkinase |
Kinexus Products
Click on entries below for direct links to relevant products from Kinexus for this protein kinase.
hiddentext
Post-translation Modifications
For detailed information on phosphorylation of this kinase go to PhosphoNET
Acetylated:
K720.
N-GlcNAcylated:
N121, N213, N261, N280,N372.
Serine phosphorylated:
S37, S459, S461, S467, S469, S485, S675, S737+.
Threonine phosphorylated:
T470.
Tyrosine phosphorylated:
Y471, Y481, Y521, Y736+, Y740+, Y741+, Y813.
Distribution
Based on gene microarray analysis from the NCBI
Human Tissue Distribution
% Max Expression:
Mean Expression:
Number of Samples:
Standard Deviation:
% Max Expression:
Mean Expression:
Number of Samples:
Standard Deviation:
 50
50
1815
34
1103
 13
13
481
13
196
 6
6
227
18
152
 11
11
413
146
1152
 26
26
955
44
755
 45
45
1665
72
4503
 4
4
157
49
344
 31
31
1122
51
2256
 9
9
336
10
265
 4
4
143
123
123
 1
1
41
36
59
 21
21
783
146
768
 3
3
113
29
69
 5
5
188
9
80
 1
1
52
34
62
 15
15
553
23
421
 14
14
503
269
909
 1
1
53
25
51
 4
4
134
114
136
 25
25
922
140
696
 4
4
131
33
103
 1
1
51
35
43
 4
4
149
27
99
 2
2
81
25
215
 1
1
41
33
59
 47
47
1733
101
3573
 2
2
69
32
49
 4
4
137
25
122
 6
6
215
25
149
 6
6
225
56
146
 12
12
425
30
216
 100
100
3666
35
8661
 4
4
133
84
421
 21
21
780
109
697
 4
4
134
61
90
Evolution
Species Conservation
PhosphoNET % Identity:
PhosphoNET % Similarity:
Homologene %
Identity:
PhosphoNET % Identity:
PhosphoNET % Similarity:
Homologene %
Identity:
 100
100
100
100 52.8
52.8
66
100 99.3
99.3
99.5
99 -
-
-
97 -
-
-
- 96.5
96.5
97.9
97 -
-
-
- 95.9
95.9
97.3
96 52.9
52.9
66.2
95 -
-
-
- 80.2
80.2
85.9
- 27.1
27.1
42.8
86 21.1
21.1
34.3
84 74.5
74.5
82.6
79 -
-
-
- 24.3
24.3
42
42 30.3
30.3
48.8
- 32.9
32.9
52
37 39.9
39.9
55.1
- -
-
-
- -
-
-
- -
-
-
- -
-
-
- -
-
-
- -
-
-
-
For a wider analysis go to PhosphoNET Evolution in PhosphoNET
Binding Proteins
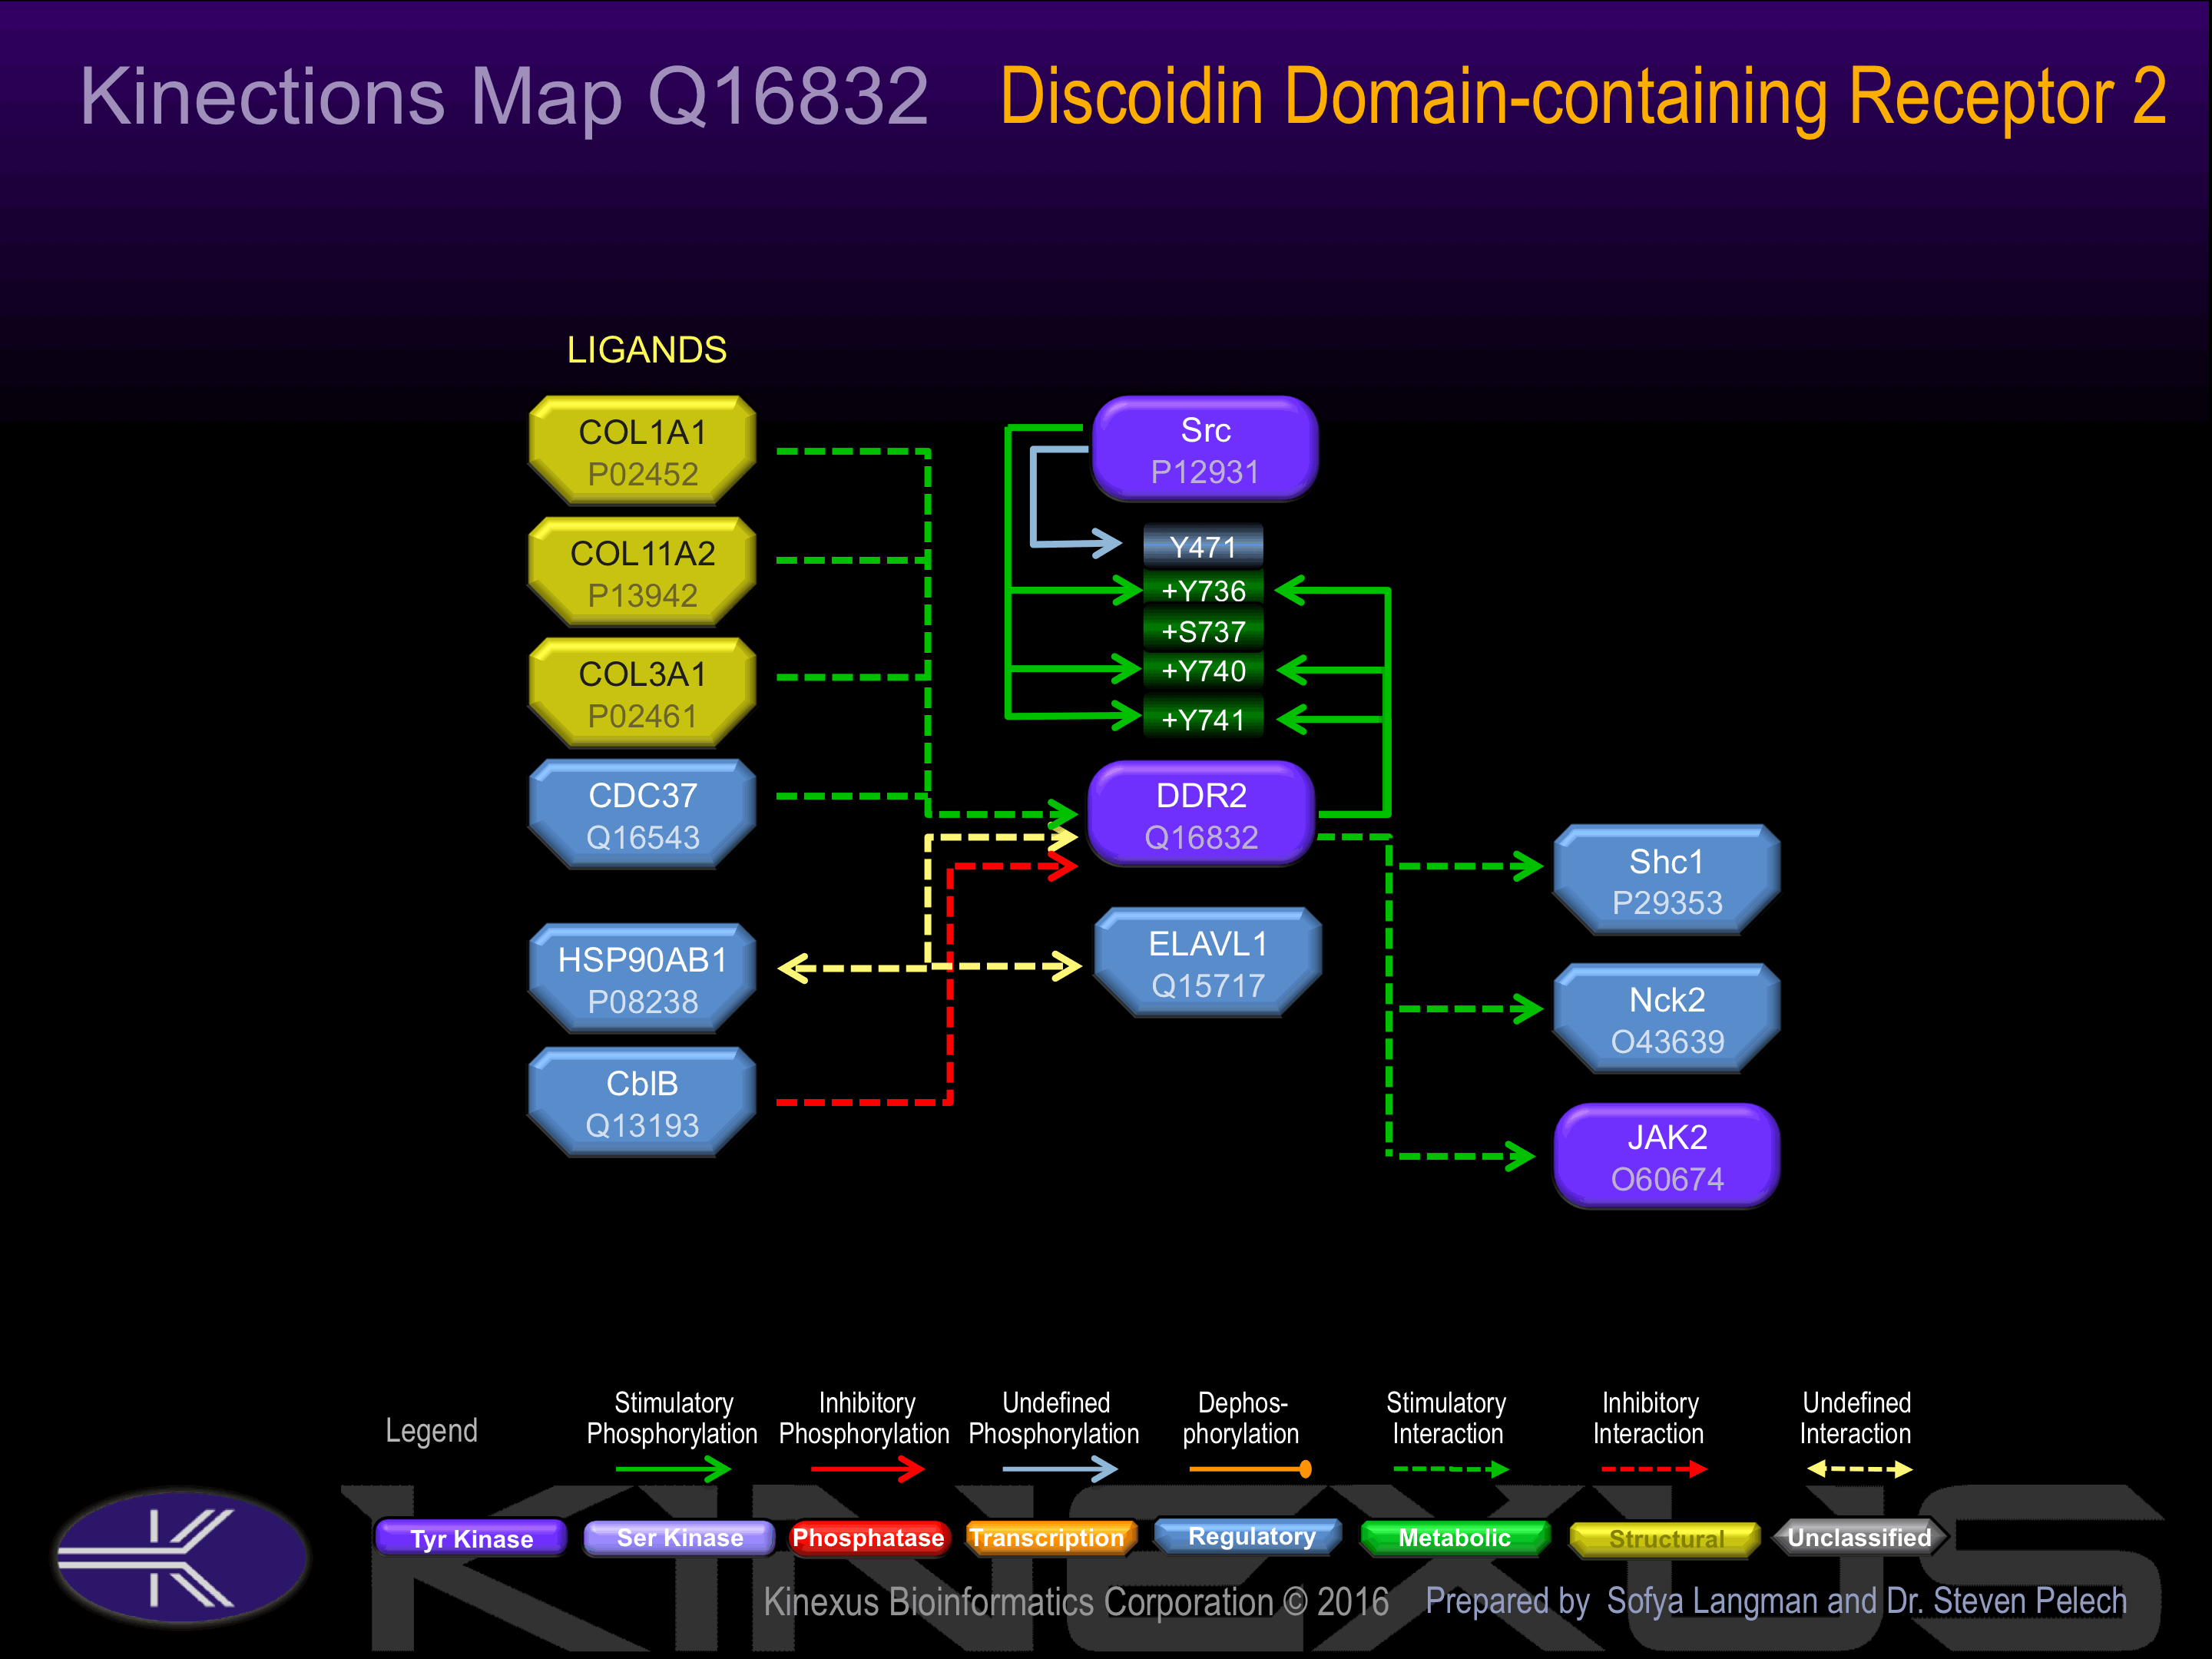
Examples of known interacting proteins
hiddentext
| No. | Name – UniProt ID |
|---|---|
| 1 | COL3A1 - P02461 |
| 2 | COL1A1 - P02452 |
Regulation
Activation:
Phosphorylation at Tyr-471 induces interaction with Shc1. Phosphorylation at Tyr-740 induces interaction with Nck2 and SHP2.
Inhibition:
NA
Synthesis:
NA
Degradation:
NA
Known Upstream Kinases
For further details on these substrates click on the Substrate Short Name or UniProt ID. Phosphosite Location is hyperlinked to PhosphoNET
predictions.
Based on in vitro and/or in vivo phosphorylation data
| Kinase Short Name | UniProt ID (Human) | Phosphosite Location | Phosphosite Sequence | Effect of Phosphorylation |
|---|
Protein Kinase Specificity
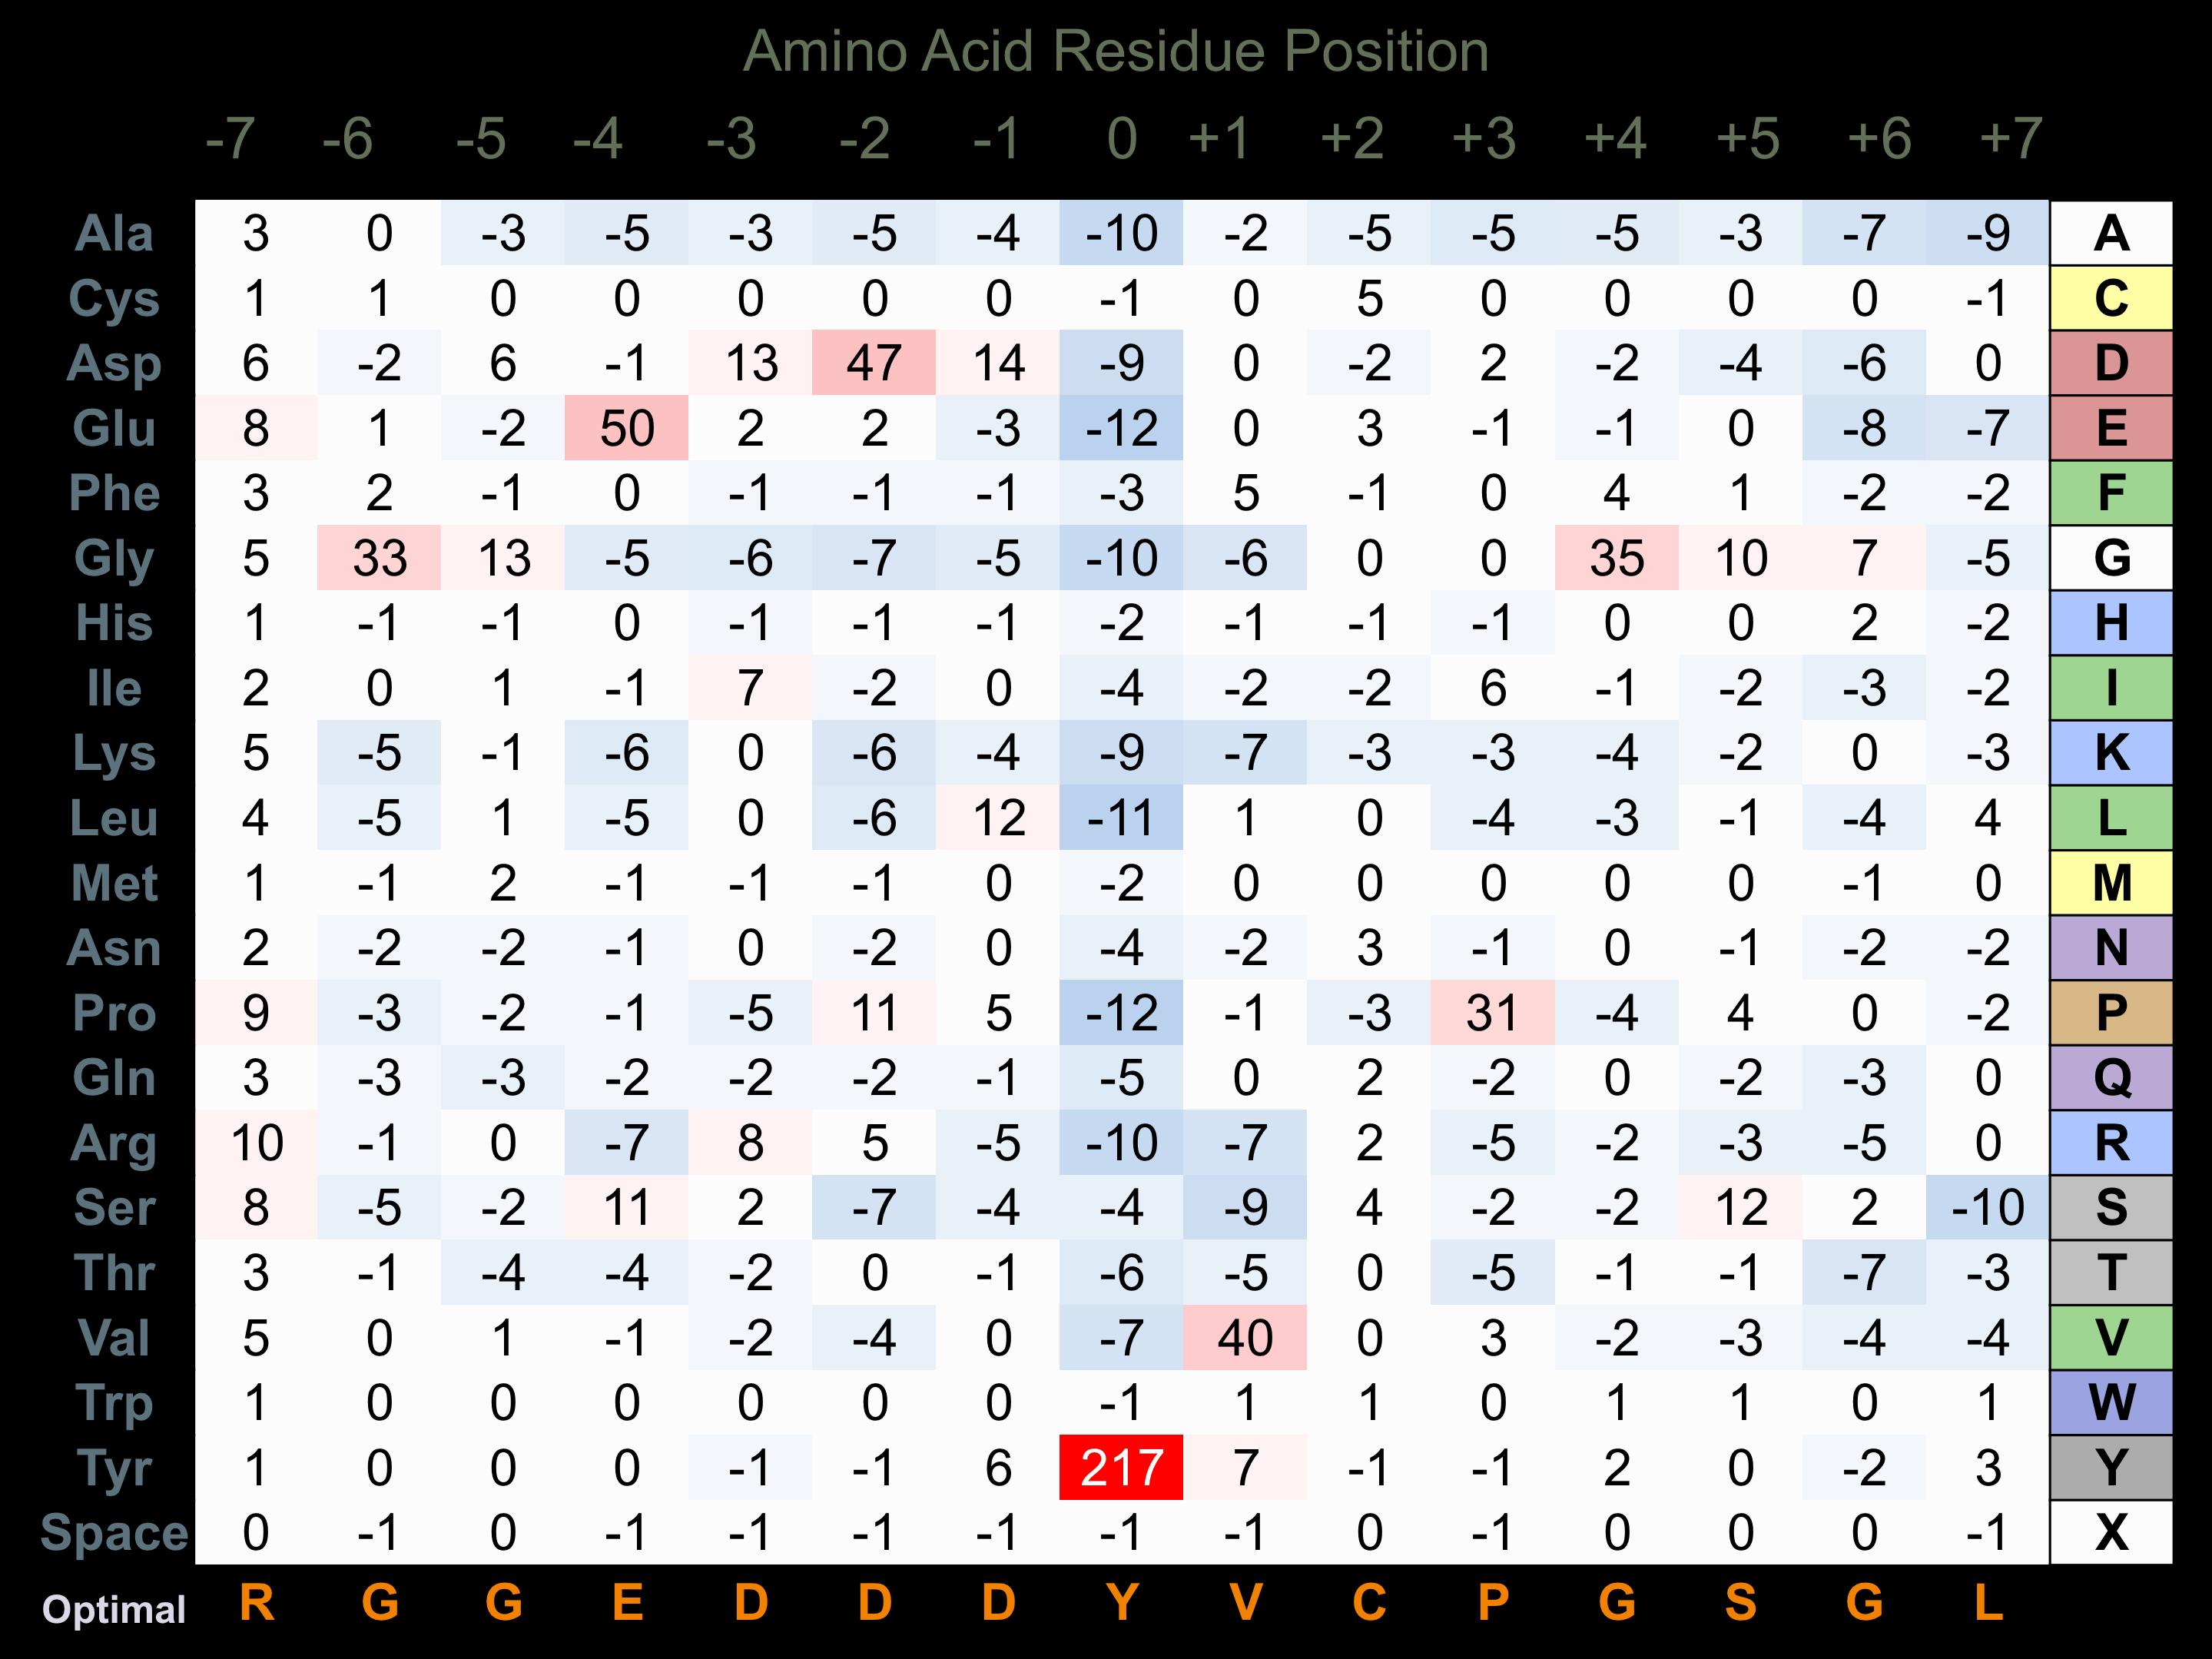
Matrix of observed frequency (%) of amino acids in aligned protein substrate phosphosites

Matrix Type:
Predicted from the application of the Kinexus Kinase Substrate Predictor Version 2.0 algorithm, which was trained with over 10,000 kinase-protein substrate pairs and 8,000 kinase-peptide substrate pairs.
Domain #:
1
Inhibitors
For further details on these inhibitors click on the Compound Name and enter it into DrugKiNET or click on the ID's
Based on in vitro and/or in vivo phosphorylation data
| Compound Name | KD, Ki or IC50 (nM) | PubChem ID | ChEMBL ID | PubMed ID |
|---|
Disease Linkage
General Disease Association:
Bone disorders
Specific Diseases (Non-cancerous):
Spondylometaepiphyseal dysplasia short limb-hand type; Spondyloepimetaphyseal dysplasia
Comments:
Several mutations in the DDR2 gene have been observed in patients with spondyloepimetaphyseal dysplasia, including several substitution mutations (R752C, I726R, T713I, E113K) and a frameshift mutation. These mutations are assocated with reduced kinase catalytic activity of the protein as they largely cause the retention of the DDR2 protein in the endoplasmic reticulum. In animal studies, mice lacking DDR2 expression appear normal at birth but display a failure to thrive during development, resulting in reduced body size, shortening of the long bones, irregular growth of flat bones, and a short snout. In addition, the reduced bone growth observed in these mice appears to be a result of reduced chondrocyte proliferation rather than increased chondrocyte apoptosis. Furthermore, mice deficit in DDR2 expression also display impaired wound healing due to the limited proliferation and migration of adult skin fibroblasts. Spondyloepimetaphyseal dysplasia is a bone disease characterized by abnormal bone growth in the vertebral column (spondyl-) and the epiphysis (end of bones). Symptoms of the disease include short-limbed dwarfism, narrow chest with pectus excavatum, brachydactyly, vision and hearing defects, and a characteristic craniofacial morphology.
Gene Expression in Cancers:
TranscriptoNET (www.transcriptonet.ca) analysis with mRNA expression data retrieved from the National Center for Biotechnology Information's Gene Expression Omnibus (GEO) database, which was normalized against 60 abundantly and commonly found proteins, indicated altered expression for this protein kinase as shown here as the percent change from normal tissue controls (%CFC) as supported with the Student T-test in the following types of human cancers: Brain glioblastomas (%CFC= -94, p<0.009); Breast epithelial cell carcinomas (%CFC= +70, p<0.008); Breast epithelial hyperplastic enlarged lobular units (HELU) (%CFC= -51, p<0.022); Cervical cancer (%CFC= -61, p<0.002); Cervical cancer stage 1B (%CFC= +48, p<0.0005); Cervical cancer stage 2A (%CFC= +76, p<0.0001); Cervical cancer stage 2B (%CFC= +51, p<0.069); Clear cell renal cell carcinomas (cRCC) stage I (%CFC= +364, p<0.001); Colon mucosal cell adenomas (%CFC= -61, p<0.0001); Colorectal adenocarcinomas (early onset) (%CFC= +289, p<0.0001); Oral squamous cell carcinomas (OSCC) (%CFC= +155, p<0.011); Ovary adenocarcinomas (%CFC= -60, p<0.0002); Pituitary adenomas (ACTH-secreting) (%CFC= -73); Prostate cancer (%CFC= +51, p<0.076); Prostate cancer - metastatic (%CFC= -81, p<0.0001); Skin fibrosarcomas (%CFC= +143); Skin melanomas - malignant (%CFC= +66, p<0.01); and Vulvar intraepithelial neoplasia (%CFC= -53, p<0.003). The COSMIC website notes an up-regulated expression score for DDR2 in diverse human cancers of 434, which is close to the average score of 462 for the human protein kinases. The down-regulated expression score of 0 for this protein kinase in human cancers was 100% lower than the average score of 60 for the human protein kinases.
Mutagenesis Experiments:
Insertional mutagenesis studies in mice have not yet revealed a role for this protein kinase in mouse cancer oncogenesis.
Mutation Rate in All Cancers:
Percent mutation rates per 100 amino acids length in human cancers: 0.08 % in 25723 diverse cancer specimens. This rate is only 13 % higher than the average rate of 0.075 % calculated for human protein kinases in general.
Mutation Rate in Specific Cancers:
Highest percent mutation rates per 100 amino acids length in human cancers: 0.36 % in 589 stomach cancers tested; 0.32 % in 805 skin cancers tested; 0.31 % in 1093 large intestine cancers tested; 0.21 % in 602 endometrium cancers tested; 0.13 % in 1941 lung cancers tested; 0.09 % in 1488 breast cancers tested; 0.06 % in 1962 central nervous system cancers tested.
Frequency of Mutated Sites:
None > 4 in 20,821 cancer specimens
Comments:
Only 1 deletion and 1 complex mutation and no insertions mutations are noted on the COSMIC website.


