
Nomenclature
Short Name:
ERK3
Full Name:
Mitogen-activated protein kinase 6
Alias:
- EC 2.7.11.24
- PRKM4
- PRKM6
- MAPK6
- Mitogen-activated protein kinase 6
- MK06
- P55-MAPK
- P97-MAPK
Classification
Type:
Protein-serine/threonine kinase
Group:
CMGC
Family:
MAPK
SubFamily:
ERK

Specific Links
Structure
Mol. Mass (Da):
82,681
# Amino Acids:
721
# mRNA Isoforms:
1
mRNA Isoforms:
82,681 Da (721 AA; Q16659)
4D Structure:
NA
1D Structure:
3D Image (rendered using PV Viewer):
PDB ID
Subfamily Alignment
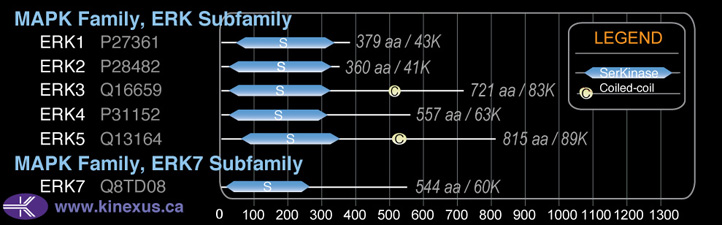
Domain Distribution:
| Start | End | Domain |
|---|---|---|
| 20 | 316 | Pkinase |
| 498 | 523 | Coiled-coil |
Kinexus Products
Click on entries below for direct links to relevant products from Kinexus for this protein kinase.
hiddentext
Post-translation Modifications
For detailed information on phosphorylation of this kinase go to PhosphoNET
Serine phosphorylated:
S189+, S363, S386, S450, S452, S483, S511, S556, S558, S665, S684, S688, S704, S705.
Threonine phosphorylated:
T54, T389, T644, T698.
Tyrosine phosphorylated:
Y182, Y209, Y357, Y453, Y467, Y468.
Ubiquitinated:
K4, K154, K276, K471, K480, K502, K517, K563, K568, K631, K636, K651.
Distribution
Based on gene microarray analysis from the NCBI
Human Tissue Distribution
% Max Expression:
Mean Expression:
Number of Samples:
Standard Deviation:
% Max Expression:
Mean Expression:
Number of Samples:
Standard Deviation:
 27
27
1007
16
989
 2
2
61
10
52
 4
4
160
6
93
 25
25
961
55
697
 29
29
1111
14
808
 42
42
1571
45
2066
 24
24
908
19
600
 100
100
3773
27
5945
 24
24
891
10
826
 6
6
210
49
101
 6
6
215
17
236
 21
21
791
89
801
 3
3
118
17
64
 2
2
77
9
85
 2
2
74
16
70
 5
5
201
8
112
 3
3
105
105
85
 3
3
101
13
84
 15
15
584
48
344
 28
28
1050
56
859
 4
4
160
15
114
 4
4
141
15
139
 5
5
189
15
108
 8
8
311
13
269
 3
3
125
15
120
 45
45
1681
36
1819
 5
5
197
20
113
 4
4
135
13
134
 3
3
131
13
139
 1
1
37
14
8
 30
30
1132
18
690
 47
47
1791
21
2832
 2
2
73
17
46
 35
35
1309
31
708
 15
15
550
22
607
Evolution
Species Conservation
PhosphoNET % Identity:
PhosphoNET % Similarity:
Homologene %
Identity:
PhosphoNET % Identity:
PhosphoNET % Similarity:
Homologene %
Identity:
 100
100
100
100 0
0
0
100 99.3
99.3
99.7
99 -
-
-
98 -
-
-
98 98.4
98.4
99.3
99 -
-
-
- 94.7
94.7
96.9
95 93.9
93.9
96.8
94 -
-
-
- 56.3
56.3
58.6
- 92.9
92.9
96.5
93 24.8
24.8
34.8
87 75.7
75.7
85
77 -
-
-
- -
-
-
- -
-
-
- -
-
-
- 32.5
32.5
49.9
- -
-
-
- -
-
-
- -
-
-
- -
-
-
- 26.7
26.7
41.4
- -
-
-
-
For a wider analysis go to PhosphoNET Evolution in PhosphoNET
Binding Proteins
Examples of known interacting proteins
hiddentext
| No. | Name – UniProt ID |
|---|---|
| 1 | PRKCB - P05771 |
Regulation
Activation:
Phosphorylation at Ser-189 increases phosphotransferase activity.
Inhibition:
NA
Synthesis:
NA
Degradation:
NA
Known Upstream Kinases
For further details on these substrates click on the Substrate Short Name or UniProt ID. Phosphosite Location is hyperlinked to PhosphoNET
predictions.
Based on in vitro and/or in vivo phosphorylation data
| Kinase Short Name | UniProt ID (Human) | Phosphosite Location | Phosphosite Sequence | Effect of Phosphorylation |
|---|
Known Downstream Substrates
For further details on these substrates click on the Substrate Short Name or UniProt ID. Phosphosite Location is hyperlinked to PhosphoNET
predictions.
Based on in vitro and/or in vivo phosphorylation data
| Substrate Short Name | UniProt ID (Human) | Phosphosite Location | Phosphosite Sequence | Effect of Phosphorylation |
|---|
Protein Kinase Specificity
Matrix of observed frequency (%) of amino acids in aligned protein substrate phosphosites
Matrix Type:
Predicted from the application of the Kinexus Kinase Substrate Predictor Version 2.0 algorithm, which was trained with over 10,000 kinase-protein substrate pairs and 8,000 kinase-peptide substrate pairs.
Domain #:
1
Inhibitors
For further details on these inhibitors click on the Compound Name and enter it into DrugKiNET or click on the ID's
Based on in vitro and/or in vivo phosphorylation data
| Compound Name | KD, Ki or IC50 (nM) | PubChem ID | ChEMBL ID | PubMed ID |
|---|
| PD173955 | Kd = 170 nM | 447077 | 386051 | 22037378 |
| JNJ-7706621 | Kd = 480 nM | 5330790 | 191003 | 18183025 |
| AC1NS7CD | Kd = 500 nM | 5329665 | 295136 | 22037378 |
| SNS032 | Kd = 500 nM | 3025986 | 296468 | 18183025 |
| WZ3146 | Kd > 1 µM | 44607360 | 20033049 | |
| WZ4002 | Kd > 1 µM | 44607530 | 20033049 | |
| TG101348 | Kd = 1.2 µM | 16722836 | 1287853 | 22037378 |
| Vandetanib | Kd = 1.5 µM | 3081361 | 24828 | 18183025 |
| Gefitinib | Kd = 1.6 µM | 123631 | 939 | 18183025 |
| Canertinib | Kd = 1.7 µM | 156414 | 31965 | 18183025 |
| Staurosporine | Kd = 3.1 µM | 5279 | 22037378 |
Disease Linkage
Gene Expression in Cancers:
TranscriptoNET (www.transcriptonet.ca) analysis with mRNA expression data retrieved from the National Center for Biotechnology Information's Gene Expression Omnibus (GEO) database, which was normalized against 60 abundantly and commonly found proteins, indicated altered expression for this protein kinase as shown here as the percent change from normal tissue controls (%CFC) as supported with the Student T-test in the following types of human cancers: Bladder carcinomas (%CFC= +83, p<0.004); Brain glioblastomas (%CFC= +243, p<0.0002); Brain oligodendrogliomas (%CFC= +213, p<0.004); Classical Hodgkin lymphomas (%CFC= +51, p<0.02); Colorectal adenocarcinomas (early onset) (%CFC= -45, p<0.003); Large B-cell lymphomas (%CFC= +65, p<0.008); Malignant pleural mesotheliomas (MPM) tumours (%CFC= +74, p<0.029); Pituitary adenomas (ACTH-secreting) (%CFC= +79); Prostate cancer (%CFC= +55, p<0.06); Skin fibrosarcomas (%CFC= -47); Skin melanomas - malignant (%CFC= -70, p<0.002); Skin squamous cell carcinomas (%CFC= +240, p<0.06); and Vulvar intraepithelial neoplasia (%CFC= +99, p<0.003). The COSMIC website notes an up-regulated expression score for ERK3 in diverse human cancers of 383, which is 0.8-fold of the average score of 462 for the human protein kinases. The down-regulated expression score of 55 for this protein kinase in human cancers was 0.9-fold of the average score of 60 for the human protein kinases.
Mutagenesis Experiments:
Insertional mutagenesis studies in mice have not yet revealed a role for this protein kinase in mouse cancer oncogenesis.
Mutation Rate in All Cancers:
Percent mutation rates per 100 amino acids length in human cancers: 0.05 % in 25371 diverse cancer specimens. This rate is only -32 % lower than the average rate of 0.075 % calculated for human protein kinases in general.
Mutation Rate in Specific Cancers:
Highest percent mutation rates per 100 amino acids length in human cancers: 0.27 % in 1093 large intestine cancers tested; 0.17 % in 805 skin cancers tested; 0.09 % in 1941 lung cancers tested.
Frequency of Mutated Sites:
Most frequent mutations with the number of reports indicated in brackets: R64H (3); R64C (2).
Comments:
No deletions, insertions or complex mutations are noted on the COSMIC website.