
Nomenclature
Short Name:
ERK4
Full Name:
Mitogen-activated protein kinase 4
Alias:
- EC 2.7.11.24
- MAP kinase isoform p63
- MAPK4
- MK04
- P63-MAPK
- PRKM4
Classification
Type:
Protein-serine/threonine kinase
Group:
CMGC
Family:
MAPK
SubFamily:
ERK

Specific Links
Structure
Mol. Mass (Da):
65922
# Amino Acids:
587
# mRNA Isoforms:
1
mRNA Isoforms:
65,922 Da (587 AA; P31152)
4D Structure:
NA
1D Structure:
Subfamily Alignment
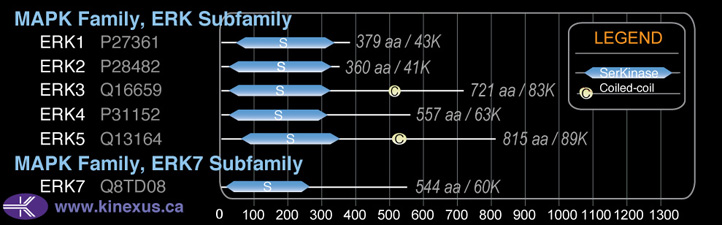
Domain Distribution:
| Start | End | Domain |
|---|---|---|
| 20 | 312 | Pkinase |
Kinexus Products
Click on entries below for direct links to relevant products from Kinexus for this protein kinase.
hiddentext
Post-translation Modifications
For detailed information on phosphorylation of this kinase go to PhosphoNET
Serine phosphorylated:
S58, S186+, S196+, S316, S412, S414, S415, S434, S508.
Threonine phosphorylated:
T294, T472, T479.
Tyrosine phosphorylated:
Y206, Y424.
Distribution
Based on gene microarray analysis from the NCBI
Human Tissue Distribution
% Max Expression:
Mean Expression:
Number of Samples:
Standard Deviation:
% Max Expression:
Mean Expression:
Number of Samples:
Standard Deviation:
 25
25
471
38
792
 2
2
46
14
62
 3
3
60
6
75
 9
9
176
108
367
 16
16
307
32
218
 0.7
0.7
14
86
50
 7
7
129
41
378
 23
23
444
35
572
 14
14
260
17
220
 2
2
33
100
59
 1.4
1.4
26
25
46
 28
28
535
163
485
 1.1
1.1
21
28
54
 0.7
0.7
13
9
19
 1.5
1.5
28
19
50
 1.1
1.1
20
19
28
 1.5
1.5
28
178
108
 2
2
38
13
62
 0.6
0.6
12
93
9
 14
14
258
137
264
 4
4
67
17
72
 1.4
1.4
27
21
75
 2
2
31
16
48
 1
1
19
13
14
 4
4
74
17
215
 23
23
434
64
442
 0.9
0.9
18
31
37
 1.3
1.3
24
13
47
 1
1
19
13
24
 4
4
67
42
57
 20
20
375
24
381
 100
100
1902
47
4311
 10
10
197
78
432
 32
32
617
83
571
 4
4
85
48
96
Evolution
Species Conservation
PhosphoNET % Identity:
PhosphoNET % Similarity:
Homologene %
Identity:
PhosphoNET % Identity:
PhosphoNET % Similarity:
Homologene %
Identity:
 100
100
100
100 0
0
0
100 98.9
98.9
99.3
99 -
-
-
- -
-
-
- 92.8
92.8
94.7
94 -
-
-
- 93.5
93.5
95.5
94 48
48
60.9
94 -
-
-
- 83.9
83.9
90.1
- 48.6
48.6
61.8
- 28.2
28.2
42.4
77 53.8
53.8
65.7
66 -
-
-
- -
-
-
- -
-
-
- -
-
-
- 32.6
32.6
48.8
- -
-
-
- -
-
-
- -
-
-
- -
-
-
- -
-
-
- -
-
-
-
For a wider analysis go to PhosphoNET Evolution in PhosphoNET
Regulation
Activation:
Phosphorylation of Ser-186 induces interaction with MAPKAPK5.
Inhibition:
NA
Synthesis:
NA
Degradation:
NA
Known Upstream Kinases
For further details on these substrates click on the Substrate Short Name or UniProt ID. Phosphosite Location is hyperlinked to PhosphoNET
predictions.
Based on in vitro and/or in vivo phosphorylation data
| Kinase Short Name | UniProt ID (Human) | Phosphosite Location | Phosphosite Sequence | Effect of Phosphorylation |
|---|
Protein Kinase Specificity
Matrix of observed frequency (%) of amino acids in aligned protein substrate phosphosites
Matrix Type:
Predicted from the application of the Kinexus Kinase Substrate Predictor Version 2.0 algorithm, which was trained with over 10,000 kinase-protein substrate pairs and 8,000 kinase-peptide substrate pairs.
Domain #:
1
Inhibitors
For further details on these inhibitors click on the Compound Name and enter it into DrugKiNET or click on the ID's
Based on in vitro and/or in vivo phosphorylation data
| Compound Name | KD, Ki or IC50 (nM) | PubChem ID | ChEMBL ID | PubMed ID |
|---|
| WZ3146 | Kd > 1 µM | 44607360 | 20033049 | |
| WZ4002 | Kd > 1 µM | 44607530 | 20033049 | |
| PD173955 | Kd = 1.1 µM | 447077 | 386051 | 22037378 |
| JNJ-7706621 | Kd = 1.6 µM | 5330790 | 191003 | 18183025 |
| Erlotinib | Kd = 2.5 µM | 176870 | 553 | 18183025 |
| Gefitinib | Kd = 3.1 µM | 123631 | 939 | 18183025 |
| AC1NS7CD | Kd = 4.1 µM | 5329665 | 295136 | 22037378 |
| SNS032 | Kd = 4.1 µM | 3025986 | 296468 | 18183025 |
Disease Linkage
General Disease Association:
Respiratory disorders (fetal)
Specific Diseases (Non-cancerous):
Pulmonary immaturity
Comments:
ERK4 knockout in mouse models produces a depression-like behaviour as assessed in the forced-swimming test. Pulmonary immaturity, also known as primary atelectasis, is a condition characterized by an immature pulmonary system relative to age at birth that is not equipped to supply sufficient levels of oxygen to the neonate, thus potentially leading to morbidity or mortality as a result of oxygen deprivation. This is especially common amongst babies born prematurely, as there has been insufficient time for the maturation of the pulmonary system.
Gene Expression in Cancers:
TranscriptoNET (www.transcriptonet.ca) analysis with mRNA expression data retrieved from the National Center for Biotechnology Information's Gene Expression Omnibus (GEO) database, which was normalized against 60 abundantly and commonly found proteins, indicated altered expression for this protein kinase as shown here as the percent change from normal tissue controls (%CFC) as supported with the Student T-test in human Prostate cancer - primary (%CFC= +109, p<0.0001).
Mutagenesis Experiments:
Insertional mutagenesis studies in mice have not yet revealed a role for this protein kinase in mouse cancer oncogenesis.
Mutation Rate in All Cancers:
Percent mutation rates per 100 amino acids length in human cancers: 0.11 % in 24433 diverse cancer specimens. This rate is a modest 1.51-fold higher than the average rate of 0.075 % calculated for human protein kinases in general.
Mutation Rate in Specific Cancers:
Highest percent mutation rates per 100 amino acids length in human cancers: 0.78 % in 805 skin cancers tested; 0.49 % in 1052 large intestine cancers tested; 0.36 % in 555 stomach cancers tested; 0.21 % in 1593 lung cancers tested; 0.14 % in 1265 breast cancers tested.
Frequency of Mutated Sites:
Most frequent mutations with the number of reports indicated in brackets: A567V (3).
Comments:
No deletions, insertions or complex mutations are noted on the COSMIC website.