
Nomenclature
Short Name:
LCK
Full Name:
Proto-oncogene tyrosine-protein kinase LCK
Alias:
- EC 2.7.10.2
- LSK
- LSK-T
- p56-LCK
- pp58Lck
- RP4-675E8.4
Classification
Type:
Protein-tyrosine kinase
Group:
TK
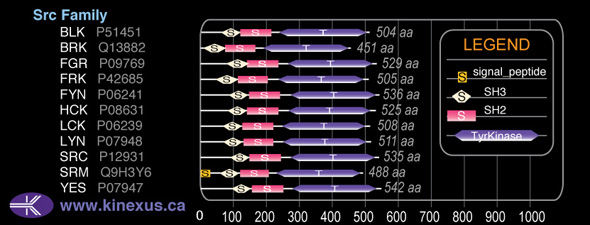
Family:
Src
SubFamily:
NA

Specific Links
Structure
Mol. Mass (Da):
58001
# Amino Acids:
509
# mRNA Isoforms:
3
mRNA Isoforms:
61,190 Da (539 AA; P06239-3); 58,001 Da (509 AA; P06239); 40,866 Da (363 AA; P06239-2)
4D Structure:
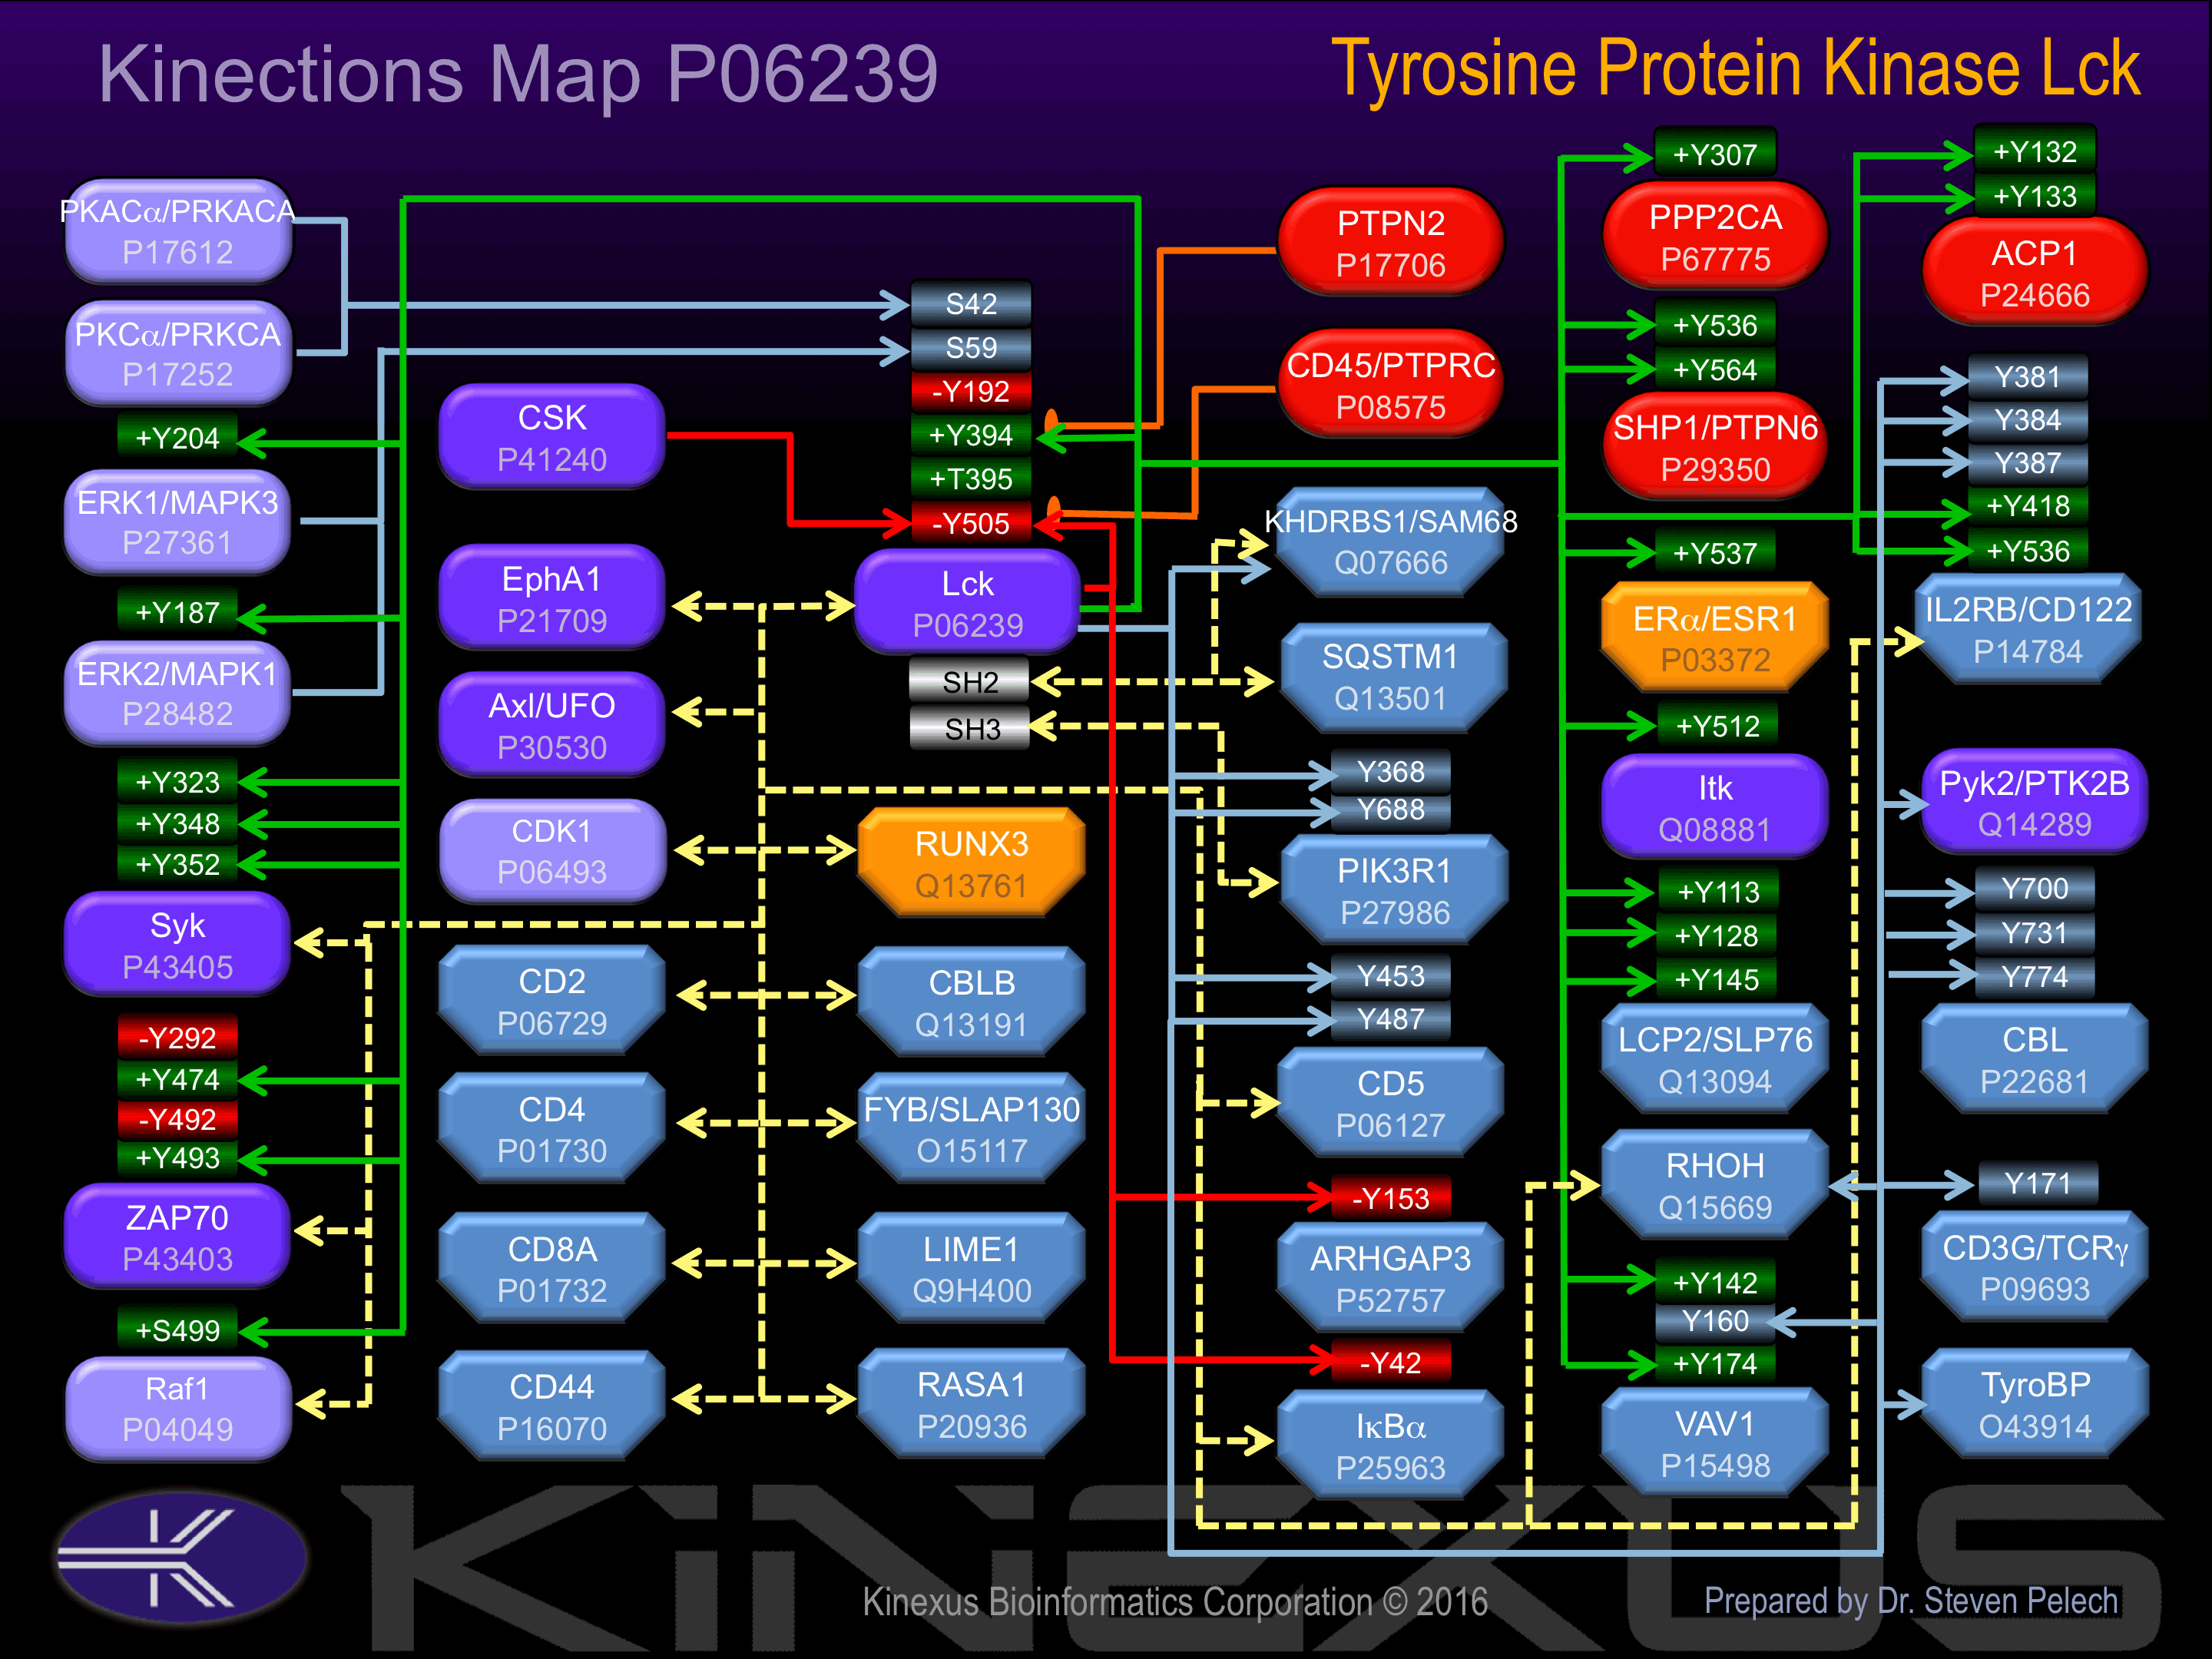
Binds to the cytoplasmic domain of cell surface receptors, such as CD2, CD4, CD5, CD8, CD44, CD45 and CD122. Also binds to effector molecules, such as PI4K, VAV1, RASA1, FYB and to other protein kinases including CDK1, RAF1, ZAP70 and SYK. Binds to phosphatidylinositol 3"-kinase (PI3K) from T-lymphocytes through its SH3 domain and to the tyrosine phosphorylated form of KHDRBS1/p70 through its SH2 domain. Binds to HIV-1 Nef through its SH3 domain. This interaction inhibits its tyrosine-kinase activity. Interacts with SQSTM1. Interacts with phosphorylated LIME1. Interacts with CBLB and PTPRH.
1D Structure:
Subfamily Alignment
Domain Distribution:
Kinexus Products
Click on entries below for direct links to relevant products from Kinexus for this protein kinase.
hiddentext
Post-translation Modifications
For detailed information on phosphorylation of this kinase go to PhosphoNET
Acetylated:
N179 (N6).
Myristoylated:
G2 (predicted).
Palmitoylated:
C3 (predicted), C5 (predicted).
Serine phosphorylated:
S42, S59, S102, S156, S158, S162, S164, S194, S213, S274, S281, S492.
Threonine phosphorylated:
T35, T50, T159, T198, T210, T268, T375, T395+, T416, T501.
Tyrosine phosphorylated:
Y25, Y51, Y181, Y192-, Y209, Y263, Y264, Y394+, Y414, Y470, Y489, Y505-.
Ubiquitinated:
K84, K179, K246, K379, K478.
Distribution
Based on gene microarray analysis from the NCBI
Human Tissue Distribution
% Max Expression:
Mean Expression:
Number of Samples:
Standard Deviation:
% Max Expression:
Mean Expression:
Number of Samples:
Standard Deviation:
 27
27
873
29
1103
 1
1
32
16
41
 0.8
0.8
27
2
20
 42
42
1347
90
3889
 14
14
462
24
425
 5
5
164
87
415
 15
15
492
39
666
 100
100
3218
42
5758
 14
14
443
17
383
 4
4
136
97
299
 1.5
1.5
47
26
51
 17
17
545
207
629
 13
13
422
24
157
 0.8
0.8
26
16
30
 2
2
49
19
53
 0.7
0.7
22
16
28
 3
3
92
283
785
 2
2
49
15
63
 0.6
0.6
19
89
14
 10
10
313
109
361
 1.4
1.4
44
19
46
 15
15
480
25
427
 3
3
99
20
89
 0.7
0.7
24
12
28
 44
44
1420
21
1329
 92
92
2948
51
5702
 10
10
332
27
118
 2
2
52
14
43
 0.9
0.9
29
13
24
 1.1
1.1
35
28
23
 49
49
1576
24
300
 58
58
1855
31
6561
 24
24
787
66
991
 19
19
607
62
607
 2
2
71
35
55
Evolution
Species Conservation
PhosphoNET % Identity:
PhosphoNET % Similarity:
Homologene %
Identity:
PhosphoNET % Identity:
PhosphoNET % Similarity:
Homologene %
Identity:
 100
100
100
100 0
0
0
98 55.8
55.8
68.5
- -
-
-
94 -
-
-
97 97.4
97.4
98.6
97 -
-
-
- 96.8
96.8
98.2
97 96.6
96.6
98
97 -
-
-
- 63
63
78.7
- 82.1
82.1
91.9
83 54.5
54.5
69.8
76 69.7
69.7
82.7
71 -
-
-
- 50
50
67.1
- -
-
-
- -
-
-
- -
-
-
- -
-
-
- -
-
-
- -
-
-
- -
-
-
- -
-
-
- -
-
-
-
For a wider analysis go to PhosphoNET Evolution in PhosphoNET
Binding Proteins
Examples of known interacting proteins
hiddentext
| No. | Name – UniProt ID |
|---|---|
| 1 | CD4 - P01730 |
| 2 | ZAP70 - P43403 |
| 3 | PTPN6 - P29350 |
| 4 | CBL - P22681 |
| 5 | PIK3CA - P42336 |
| 6 | PIK3R1 - P27986 |
| 7 | NFKBIA - P25963 |
| 8 | PRKCQ - Q04759 |
| 9 | MAPK1 - P28482 |
| 10 | SPNS1 - Q9H2V7 |
| 11 | CD44 - P16070 |
| 12 | CTLA4 - P16410 |
| 13 | LCP2 - Q13094 |
| 14 | TRAT1 - Q6PIZ9 |
| 15 | CD79B - P40259 |
Regulation
Activation:
Phosphorylation of Tyr-394 increases phosphotransferase activity and induces interaction with Lck.
Inhibition:
Phosphorylation of Tyr-192 and Tyr-505 inhibits Lck phosphotransferase activity.
Synthesis:
NA
Degradation:
NA
Known Upstream Kinases
For further details on these substrates click on the Substrate Short Name or UniProt ID. Phosphosite Location is hyperlinked to PhosphoNET
predictions.
Based on in vitro and/or in vivo phosphorylation data
| Kinase Short Name | UniProt ID (Human) | Phosphosite Location | Phosphosite Sequence | Effect of Phosphorylation |
|---|
Known Downstream Substrates
For further details on these substrates click on the Substrate Short Name or UniProt ID. Phosphosite Location is hyperlinked to PhosphoNET
predictions.
Based on in vitro and/or in vivo phosphorylation data
| Substrate Short Name | UniProt ID (Human) | Phosphosite Location | Phosphosite Sequence | Effect of Phosphorylation |
|---|
| ACP1 (Low Mr PTPase) | P24666 | Y132 | QLIIEDPYYGNDSDF | + |
| ACP1 (Low Mr PTPase) | P24666 | Y133 | LIIEDPYYGNDSDFE | + |
| ADAM15 | Q13444 | Y715 | LVMLGASYWYRARLH | |
| ARHGAP3 | P52757 | Y153 | KMTTNPIYEHIGYAT | - |
| Cbl | P22681 | Y700 | EGEEDTEYMTPSSRP | |
| Cbl | P22681 | Y731 | QQIDSCTYEAMYNIQ | |
| Cbl | P22681 | Y774 | SENEDDGYDVPKPPV | |
| CCDC50 iso2 | Q8IVM0-2 | Y217 | MAEEKKAYKKAKERE | |
| CCDC50 iso2 | Q8IVM0-2 | Y279 | TDGEDADYTHFTNQQ | |
| CCDC50 iso2 | Q8IVM0-2 | Y304 | SSHKGFHYKH_____ | |
| CD28 | P10747 | Y191 | SRLLHSDYMNMTPRR | |
| CD33 | P20138 | Y340 | EMDEELHYASLNFHG | |
| CD3E | P07766 | Y188 | PPVPNPDYEPIRKGQ | |
| CD3G | P09693 | Y171 | KDREDDQYSHLQGNQ | |
| CD3Z | P20963 | Y111 | KNPQEGLYNELQKDK | |
| CD3Z | P20963 | Y142 | GKGHDGLYQGLSTAT | |
| CD3Z | P20963 | Y72 | QQGQNQLYNELNLGR | |
| CD5 | P06127 | Y453 | ASHVDNEYSQPPRNS | |
| CD5 | P06127 | Y487 | DNSSDSDYDLHGAQR | |
| CTLA-4 | P16410 | Y201 | SPLTTGVYVKMPPTE | |
| CTLA-4 | P16410 | Y218 | CEKQFQPYFIPIN__ | |
| DAPP1 | Q9UN19 | Y139 | KVEEPSIYESVRVHT | |
| DGK-A | P23743 | Y335 | ILPPSSIYPSVLASG | |
| ERa (ESR1) | P03372 | Y537 | CKNVVPLYDLLLEML | + |
| ERK1 (MAPK3) | P27361 | Y204 | HTGFLTEYVATRWYR | + |
| ERK2 (MAPK1) | P28482 | Y187 | HTGFLTEYVATRWYR | + |
| Ezrin | P15311 | Y146 | KEVHKSGYLSSERLI | |
| G3BP1 | Q13283 | Y56 | GKPADAVYGQKEIHR | |
| IkBa | P25963 | Y42 | DSMKDEEYEQMVKEL | - |
| IL2RB | P14784 | Y381 | EIEACQVYFTYDPYS | |
| IL2RB | P14784 | Y384 | ACQVYFTYDPYSEED | |
| IL2RB | P14784 | Y387 | VYFTYDPYSEEDPDE | |
| IL2RB | P14784 | Y418 | LSGEDDAYCTFPSRD | + |
| IL2RB | P14784 | Y536 | LPLNTDAYLSLQELQ | + |
| Itk | Q08881 | Y512 | RFVLDDQYTSSTGTK | + |
| LAT | O43561 | Y200 | SMESIDDYVNVPESG | |
| LAT | O43561 | Y220 | SLDGSREYVNVSQEL | |
| Lck | P06239 | Y394 | RLIEDNEYTAREGAK | + |
| Lck | P06239 | Y505 | FTATEGQYQPQP___ | - |
| LCP2 | Q13094 | Y113 | SSFEEDDYESPNDDQ | + |
| LCP2 | Q13094 | Y128 | DGEDDGDYESPNEEE | + |
| LCP2 | Q13094 | Y145 | PVEDDADYEPPPSND | + |
| MED28 | Q9H204 | Y64 | ASLVSQDYVNGTDQE | |
| MUC1 | P15941 | Y1203 | IFPARDTYHPMSEYP | |
| p38a MAPK (MAPK14) | Q16539 | Y323 | DEPVADPYDQSFESR | + |
| PECAM-1 | P16284 | Y690 | PLNSDVQYTEVQVSS | + |
| PECAM-1 | P16284 | Y713 | KKDTETVYSEVRKAV | + |
| PIK3R1 | P27986 | Y368 | STKMHGDYTLTLRKG | |
| PIK3R1 | P27986 | Y688 | FAEPYNLYSSLKELV | |
| PKCd (PRKCD) | Q05655 | Y313 | SSEPVGIYQGFEKKT | + |
| PKCd (PRKCD) | Q05655 | Y334 | MQDNSGTYGKIWEGS | ? |
| PKCd (PRKCD) | Q05655 | Y514 | TFCGTPDYIAPEILQ | - |
| PKCt (PRKCQ) | Q04759 | Y90 | SETTVELYSLAERCR | + |
| PLCG2 | P16885 | Y1197 | LESEEELYSSCRQLR | |
| PLCG2 | P16885 | Y1217 | LNNQLFLYDTHQNLR | |
| PLCG2 | P16885 | Y753 | ERDINSLYDVSRMYV | + |
| PLCG2 | P16885 | Y759 | LYDVSRMYVDPSEIN | + |
| PPP2CA | P67775 | Y307 | VTRRTPDYFL_____ | + |
| PRDX1 (NKEF-A) | Q06830 | Y194 | DVQKSKEYFSKQK__ | - |
| PTEN | P60484 | Y240 | RREDKFMYFEFPQPL | + |
| PTEN | P60484 | Y315 | RADNDKEYLVLTLTK | + |
| PTPN6 (SHP1) | P29350 | Y536 | QKGQESEYGNITYPP | + |
| PTPN6 (SHP1) | P29350 | Y564 | SKHKEDVYENLHTKN | + |
| Raf1 | P04049 | S499 | VKSRWSGSQQVEQPT | + |
| RasGAP | P20936 | Y460 | TVDGKEIYNTIRRKT | |
| SH2D2A (TSAd) | Q9NP31 | Y260 | PQLPPEVYTIPVPRH | + |
| SH2D2A (TSAd) | Q9NP31 | Y280 | PKPSNPIYNEPDEPI | + |
| SH2D2A (TSAd) | Q9NP31 | Y290 | PDEPIAFYAMGRGSP | + |
| SH2D2A (TSAd) | Q9NP31 | Y305 | GEAPSNIYVEVEDEG | + |
| Shc1 | P29353 | Y349 | EEPPDHQYYNDFPGK | + |
| Shc1 | P29353 | Y350 | EPPDHQYYNDFPGKE | + |
| Shc1 | P29353 | Y427 | ELFDDPSYVNVQNLD | ? |
| SHIP | Q92835 | Y1022 | EMFENPLYGSLSSFP | |
| SHIP | Q92835 | Y915 | TEIINPNYMGVGPFG | |
| SIGLEC10 | Q96LC7 | Y597 | RHSTILDYINVVPTA | |
| SIGLEC10 | Q96LC7 | Y667 | ESQEELHYATLNFPG | |
| SIGLEC10 | Q96LC7 | Y691 | PKGTQADYAEVKFQ_ | |
| SLAM | Q13291 | Y307 | QDPCTTIYVAATEPV | |
| SOCS3 | O14543 | Y204 | VNGHLDSYEKVTQLP | - |
| SOCS3 | O14543 | Y221 | IREFLDQYDAPL___ | + |
| SPTAN1 | Q13813 | Y1176 | AVQQQEVYGMMPRDE | |
| SSBP3 | Q9BWW4 | Y23 | AREKLALYVYEYLLH | |
| SSBP3 | Q9BWW4 | Y25 | EKLALYVYEYLLHVG | |
| STAT2 | P52630 | Y690 | NLQERRKYLKHRLIV | + |
| STAT5A | P42229 | Y694 | LAKAVDGYVKPQIKQ | + |
| Syk | P43405 | Y323 | STVSFNPYEPELAPW | + |
| Syk | P43405 | Y348 | LPMDTEVYESPYADP | + |
| Syk | P43405 | Y352 | TEVYESPYADPEEIR | + |
| VAV1 | P15498 | Y142 | SVGDEDIYSGLSDQI | + |
| VAV1 | P15498 | Y160 | VEEDEDLYDCVENEE | |
| VAV1 | P15498 | Y174 | EAEGDEIYEDLMRSE | + |
| WASP | P42768 | Y291 | AETSKLIYDFIEDQG | + |
| ZAP70 | P43403 | Y292 | DTLNSDGYTPEPARI | - |
| ZAP70 | P43403 | Y474 | VLLVNRHYAKISDFG | + |
| ZAP70 | P43403 | Y492 | ALGADDSYYTARSAG | - |
| ZAP70 | P43403 | Y493 | LGADDSYYTARSAGK | + |
Protein Kinase Specificity
Matrix of observed frequency (%) of amino acids in aligned protein substrate phosphosites
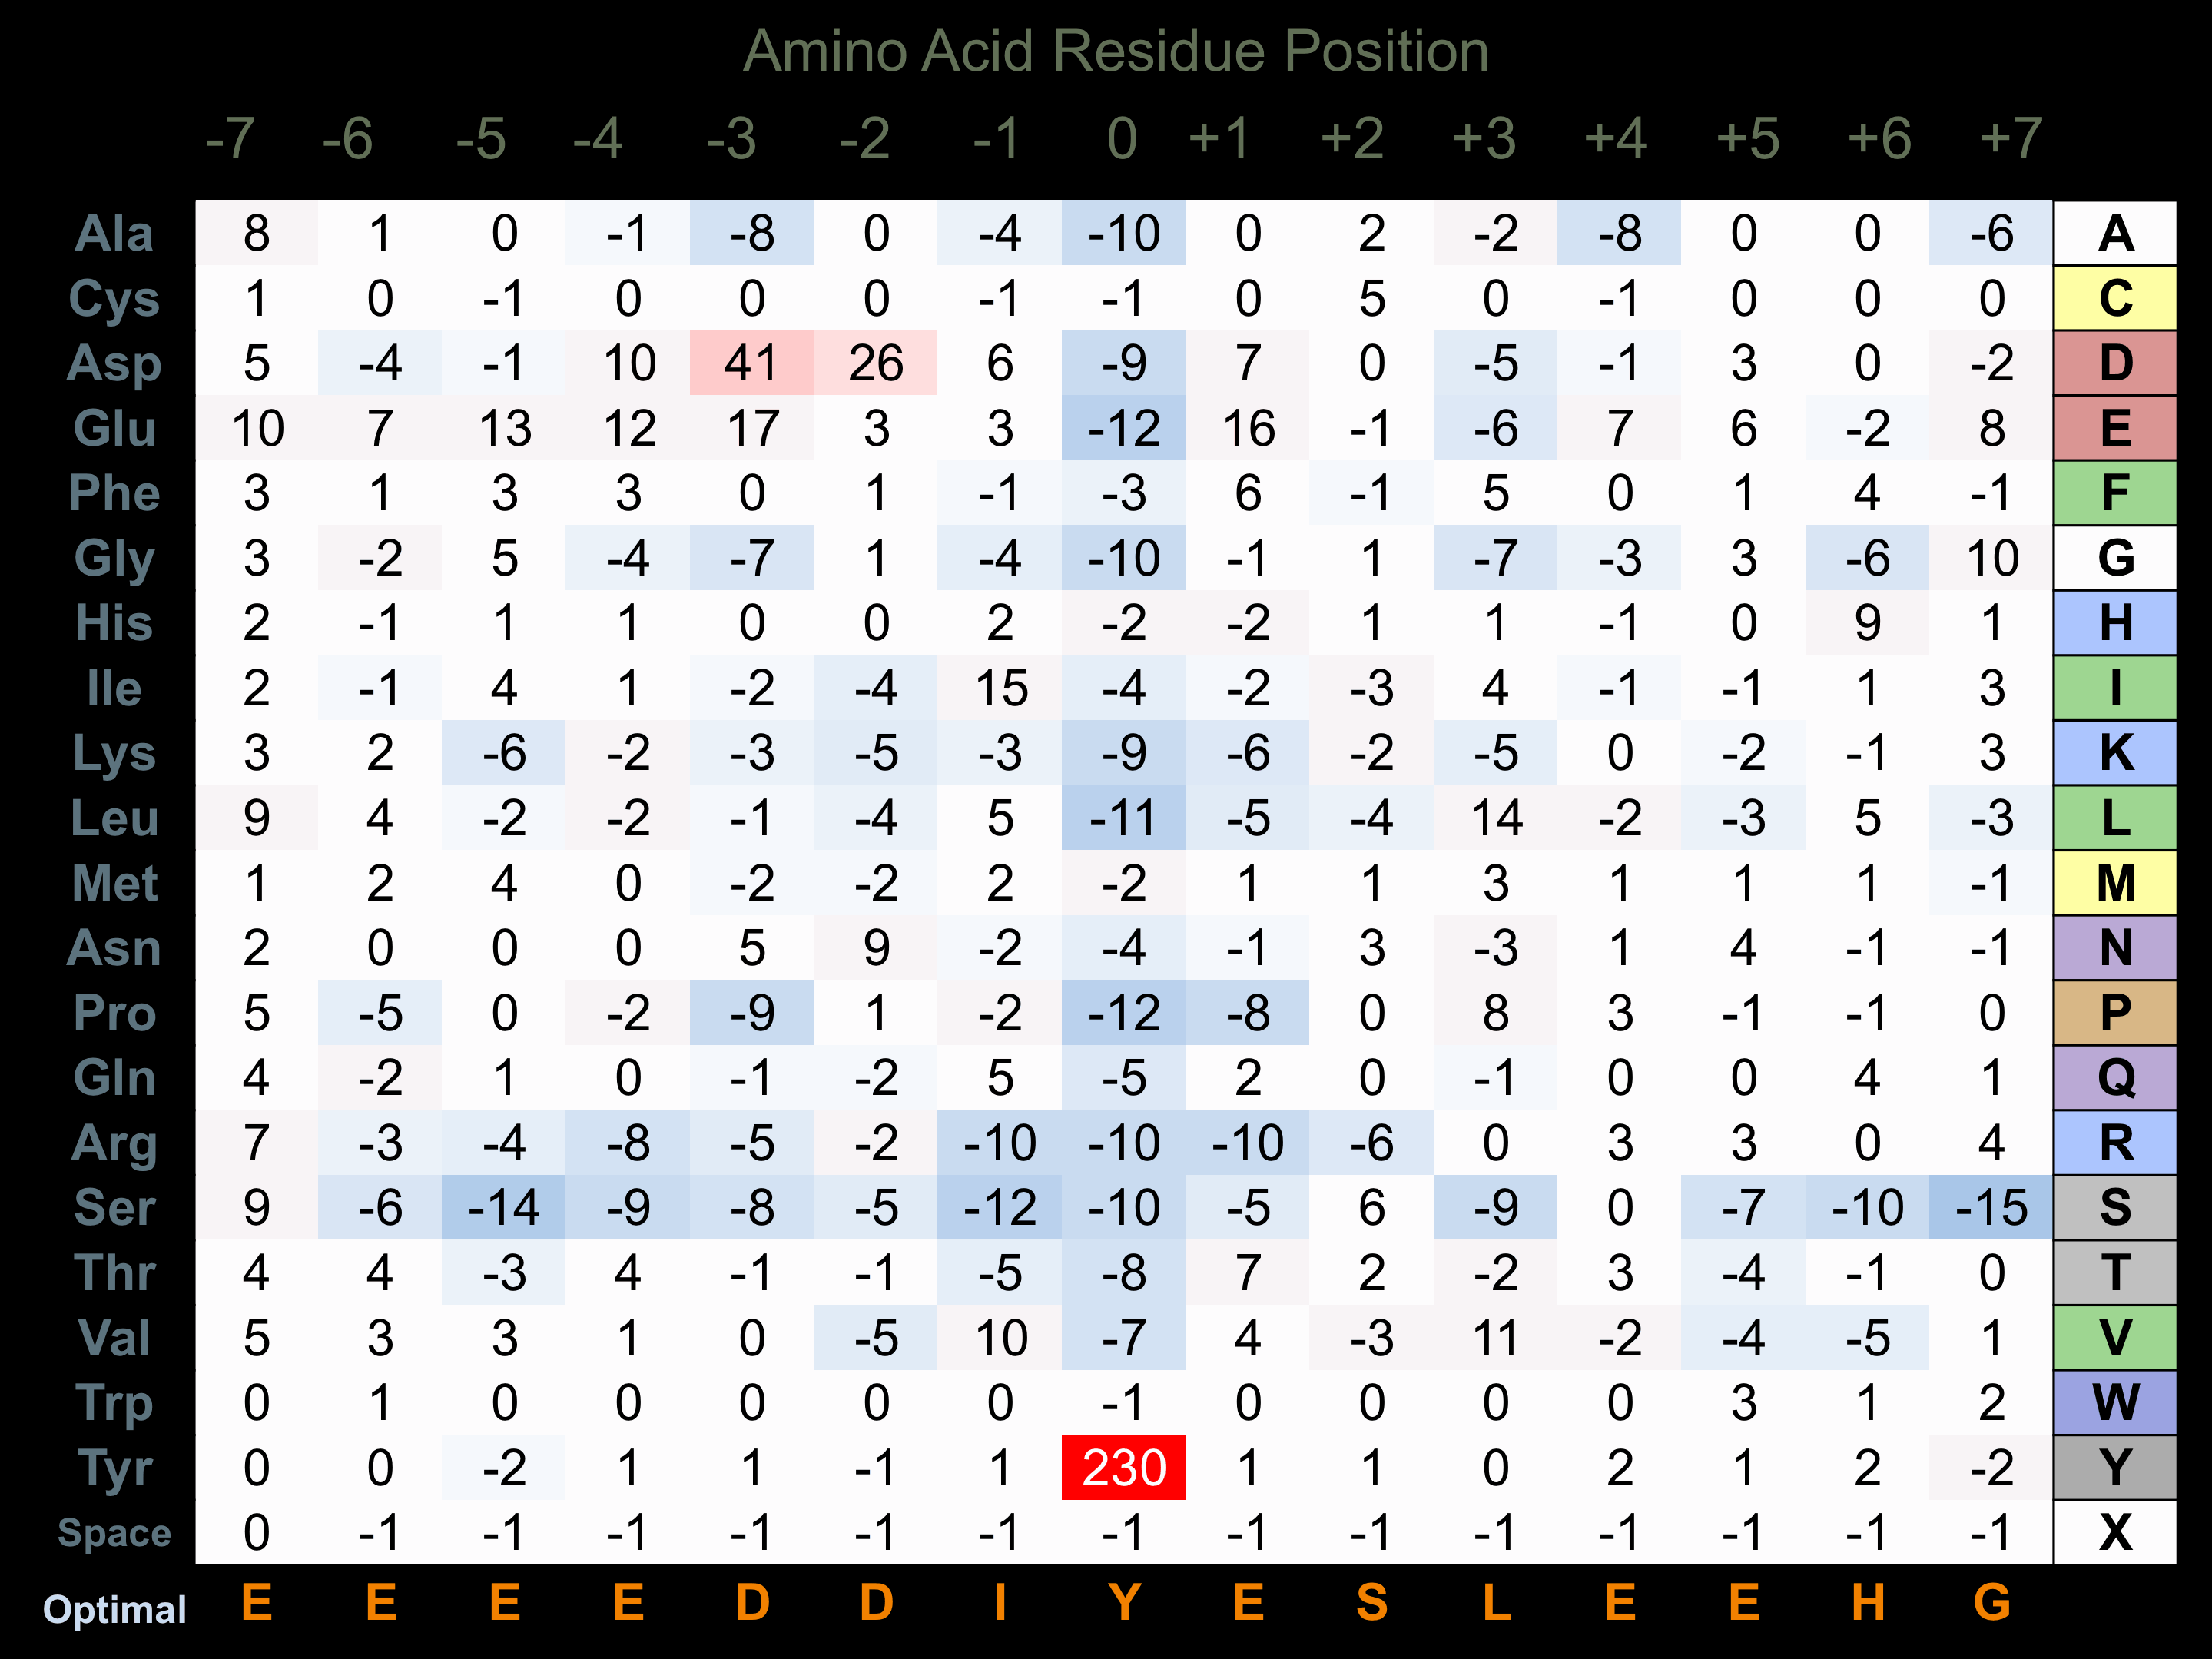
Matrix Type:
Experimentally derived from alignment of 107 known protein substrate phosphosites and 12 peptides phosphorylated by recombinant Lck in vitro tested in-house by Kinexus.
Domain #:
1
Inhibitors
For further details on these inhibitors click on the Compound Name and enter it into DrugKiNET or click on the ID's
Based on in vitro and/or in vivo phosphorylation data
| Compound Name | KD, Ki or IC50 (nM) | PubChem ID | ChEMBL ID | PubMed ID |
|---|
Disease Linkage
General Disease Association:
Immune disorders
Specific Diseases (Non-cancerous):
Immunodeficiency 22
Comments:
In animal studies, mice lacking Lck display a phenotype resembling severe-combined immunodeficiency (SCID). In additional, transgenic mice that express a dominant-negative form of Lck display severe defects in T-cell development. Furthermore, it was demonstrated in mice that naive, but not memory, CD8+ T-cells require an active Lck for cell activation, possibly explaining the observation that memory T-cells show hyperreactivity to antigens and accerlated immune regulation during a secondary infection. A significantly reduced Lck protein level was observed in an infant with IMD22 and selective CD4 lymphopenia. The reduced expression of Lck was attributed to an alternatively spliced Lck mRNA transcript that lacked exon-7, as no mutation was observed in the Lck coding region. Additionally, the same splice variant was found in a Japanese patient with a similar immunodeficient phenotype and Lck levels ~40% lower than controls. In another case of IMD22, a missense mutation (L341P) was observed at a highly conserved residue in the kinase domain of the Lck protein that resulted in significantly decreased Lck protein expression. In addition, the L341P mutant Lck protein had no kinase catalytic activity and failed to complement TCR signalling in Lck-deficient cells. The patient with the L341P mutation displayed CD4+ T-cell lymphopenia and reduced expression of both T-cell specific CD4 and CD8. In addition, residual T-cells displayed a significant defect in TCR signalling, consistent with the IMD22 phenotype and a loss-of-function of the Lck protein. Furthermore, the binding of the HIV-1 virus to CD4 receptors stimualtes the Lck-Raf-1 pathway, which is thought to be a critical step in the transcriptional activation of the integral HIV-1 provirus and thus the pathogenicity of the disease.
Comments:
LCK may be an oncoprotein (OP) based on its similarity to other Src family protein-tyrosine kinases.
Gene Expression in Cancers:
TranscriptoNET (www.transcriptonet.ca) analysis with mRNA expression data retrieved from the National Center for Biotechnology Information's Gene Expression Omnibus (GEO) database, which was normalized against 60 abundantly and commonly found proteins, indicated altered expression for this protein kinase as shown here as the percent change from normal tissue controls (%CFC) as supported with the Student T-test in the following types of human cancers: Classical Hodgkin lymphomas (%CFC= +207, p<0.002); Colorectal adenocarcinomas (early onset) (%CFC= +126, p<0.012); Large B-cell lymphomas (%CFC= +543, p<0.042); Oral squamous cell carcinomas (OSCC) (%CFC= +220, p<0.003); Skin melanomas (%CFC= +196, p<0.038); and Vulvar intraepithelial neoplasia (%CFC= +61, p<0.069). The COSMIC website notes an up-regulated expression score for LCK in diverse human cancers of 275, which is 0.6-fold of the average score of 462 for the human protein kinases. The down-regulated expression score of 2 for this protein kinase in human cancers was 97% lower than the average score of 60 for the human protein kinases.
Mutagenesis Experiments:
Insertional mutagenesis studies in mice have not yet revealed a role for this protein kinase in mouse cancer oncogenesis.
Mutation Rate in All Cancers:
Percent mutation rates per 100 amino acids length in human cancers: 0.1 % in 25716 diverse cancer specimens. This rate is only 32 % higher than the average rate of 0.075 % calculated for human protein kinases in general.
Mutation Rate in Specific Cancers:
Highest percent mutation rates per 100 amino acids length in human cancers: 0.78 % in 805 skin cancers tested; 0.56 % in 1152 large intestine cancers tested; 0.17 % in 1941 lung cancers tested.
Frequency of Mutated Sites:
None > 5 in 20,954 cancer specimens
Comments:
No deletions, insertions or complex mutations are noted on the COSMIC website.