• KinATLAS
  • TranscriptoNET
  • PhosphoNET
  • OncoNET
  • KinaseNET
  • DrugKiNET
  • DrugProNET
  • KiNET-AM
  • Kinetica Online

Updated November 2019

Home | Kinexus | Contact | Credits

Nomenclature

Short Name:
MARK1
Full Name:
Serine-threonine-protein kinase MARK1
Alias:
  • EC 2.7.11.1
  • KIAA1477
  • MAP/microtubule affinity-regulating kinase 1
  • MARK

Classification

Type:
Protein-serine/threonine kinase
Group:
CAMK
Family:
CAMKL
SubFamily:
MARK


Specific Links

Entrez-Gene Entry: 4139
Entrez-Protein Entry: NP_061120
GeneCards Entry: MARK.
KinBASE Entry: MARK1
OMIM Entry: 606511
Pfam Entry: Q9P0L2
PhosphoNET Entry: Q9P0L2
Phosphosite Plus Entry: 2100
Protein Data Bank Entry: 2HAK
Source Entry: MARK1
UCSD-Nature Entry: A003006
UniProt Entry: Q9P0L2
Kinexus Products: MARK1
MAP/microtubule affinity-regulating protein-serine kinase 1 pan-specific antibody AB-NK098-2
MAP/microtubule affinity-regulating protein-serine kinase 1 T215 phosphosite-specific antibody AB-PK694
MAP/microtubule affinity-regulating protein-serine kinase 1 T215 phosphosite-specific antibody AB-PK695
Cdc25C (205-225), KinSub - Cdc25C phosphatase (V205-R225, human) peptide; Chktide peptide - Powder PE-01ACN95
MAP/microtubule affinity-regulating protein-serine kinase 1 (Y24-C43, human) peptide - Powder PE-01BDQ90
MAP/microtubule affinity-regulating protein-serine kinase 1 (K212-G218, human) pT215 phosphopeptide - Powder PE-04AAT95
MAP/microtubule affinity-regulating protein-serine kinase 1 (N211-F216, human) pT215 phosphopeptide - Powder PE-04ANQ95

General Links

ClustalW2
GPS-Cuckoo
Human Protein Atlas
Kinase.com
Kinase Research
Kinasource
Kinomer
Netphorest
NetworKIN
Phosida
PhosphoElm
Protein Blast
ScanSite
String

Structure

Mol. Mass (Da):
89003
# Amino Acids:
795
# mRNA Isoforms:
3
mRNA Isoforms:
89,003 Da (795 AA; Q9P0L2); 84,911 Da (758 AA; Q9P0L2-3); 72,073 Da (645 AA; Q9P0L2-2)
4D Structure:
NA
1D Structure:
Retrieve Gene Sequence
Retrieve Full Protein Sequence
Retrieve Catalytic Domain Sequence
 
3D Image (rendered using PV Viewer):

PDB ID
2HAK

Subfamily Alignment
subfamily domain
 
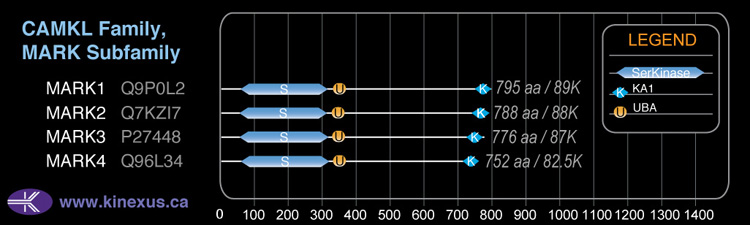
Domain Distribution:
Start End Domain
60 311 Pkinase
325 370 UBA
746 795 KA1
 

Kinexus Products

Click on entries below for direct links to relevant products from Kinexus for this protein kinase.
hiddentext
○ MAP/microtubule affinity-regulating protein-serine kinase 1 pan-specific antibody AB-NK098-2
○ MAP/microtubule affinity-regulating protein-serine kinase 1 T215 phosphosite-specific antibody AB-PK694
○ MAP/microtubule affinity-regulating protein-serine kinase 1 T215 phosphosite-specific antibody AB-PK695
○ Cdc25C (205-225), KinSub - Cdc25C phosphatase (V205-R225, human) peptide; Chktide peptide - Powder PE-01ACN95
○ MAP/microtubule affinity-regulating protein-serine kinase 1 (Y24-C43, human) peptide - Powder PE-01BDQ90
○ MAP/microtubule affinity-regulating protein-serine kinase 1 (K212-G218, human) pT215 phosphopeptide - Powder PE-04AAT95
○ MAP/microtubule affinity-regulating protein-serine kinase 1 (N211-F216, human) pT215 phosphopeptide - Powder PE-04ANQ95
 

Post-translation Modifications

For detailed information on phosphorylation of this kinase go to PhosphoNET
Serine phosphorylated:

S36, S46, S219-, S382, S393, S399, S403, S423, S444, S463, S468, S470, S475, S498, S556, S573, S588, S590, S593, S595, S612, S624, S633, S649, S679, S681, S699, S710, S711, S766, S787.
Threonine phosphorylated:

T5, T65, T208+, T215+, T465, T504, T580, T581, T596, T598, T613-, T708, T709.
Tyrosine phosphorylated:

Y494, Y505+.
Ubiquitinated:
K783.
 

Distribution

Based on gene microarray analysis from the NCBI
Human Tissue Distribution
% Max Expression:

Mean Expression:

Number of Samples:

Standard Deviation:
% Max Expression:

Mean Expression:

Number of Samples:

Standard Deviation:
  • adipose
    100

    1169

    37

    958

  • adrenal
    2

    18

    11

    13

  • bladder
    6

    68

    1

    0

  • brain
    19

    224

    115

    333

  • breast
    46

    533

    41

    401

  • cervix
    4

    46

    64

    47

  • colon
    0.9

    10

    45

    9

  • heart
    37

    437

    22

    612

  • intestine
    23

    274

    10

    263

  • kidney
    4

    42

    85

    31

  • liver
    4

    45

    16

    41

  • lung
    60

    705

    85

    489

  • lymphnode
    3

    38

    12

    22

  • ovary
    2

    28

    6

    16

  • pancreas
    5

    54

    13

    46

  • pituitary
    2

    20

    22

    26

  • prostate
    6

    66

    106

    37

  • salivarygland
    4

    47

    6

    47

  • skeletalmuscle"
    5

    55

    73

    31

  • skin
    43

    506

    135

    401

  • spinalcord
    8

    96

    12

    77

  • spleen
    4

    47

    14

    41

  • stomach
    4

    51

    2

    7

  • testis
    9

    103

    6

    69

  • thymus
    4

    52

    12

    51

  • thyroid
    47

    548

    74

    476

  • tonsil
    4

    42

    15

    21

  • trachea
    5

    53

    6

    49

  • uterus
    5

    54

    6

    51

  • reticulocytes"
    11

    132

    42

    85

  • t-lymphocytes
    27

    315

    18

    218

  • b-lymphocytes
    24

    277

    36

    418

  • neutrophils
    24

    279

    88

    1035

  • macrophages
    51

    596

    104

    519

  • sperm
    17

    197

    61

    191


Evolution

Species Conservation
PhosphoNET % Identity:
PhosphoNET % Similarity:
Homologene %
Identity:
PhosphoNET % Identity:
PhosphoNET % Similarity:
Homologene %
Identity:
  • tableheader
    100

    100

    100
  • tableheader
    99.3

    99.4

    99
  • tableheader
    68.9

    80.3

    99.5
  • tableheader
    -

    -

    97
  • tableheader
    -

    -

    -
  • tableheader
    96

    96.9

    98
  • tableheader
    -

    -

    -
  • tableheader
    95

    97.4

    94
  • tableheader
    94.3

    97

    95
  • tableheader
    -

    -

    -
  • tableheader
    92.8

    96

    -
  • tableheader
    30.4

    51.4

    92
  • tableheader
    88.7

    94.2

    89
  • tableheader
    27.9

    44.1

    84
  • tableheader
    -

    -

    -
  • tableheader
    -

    -

    -
  • tableheader
    -

    -

    -
  • tableheader
    40.8

    51.1

    39
  • tableheader
    -

    -

    -
  • tableheader
    -

    -

    -
  • tableheader
    -

    -

    -
  • tableheader
    -

    -

    -
  • tableheader
    27.9

    44.4

    -
  • tableheader
    28.1

    46.7

    -
  • tableheader
    -

    -

    -
For a wider analysis go to PhosphoNET Evolution in PhosphoNET
 

Binding Proteins

Examples of known interacting proteins
hiddentext
No. Name – UniProt ID
1 STK11 - Q15831
2 TAOK1 - Q7L7X3
3 NUAK1 - O60285
4 YWHAZ - P63104
5 YWHAE - P62258
 

Regulation

Activation:
Activated by phosphorylation on Thr-215 by STK11 in complex with STE20-related adapter-alpha (STRAD alpha) pseudo kinase and CAB39.
Inhibition:
NA
Synthesis:
NA
Degradation:
NA
 

Known Upstream Kinases

For further details on these substrates click on the Substrate Short Name or UniProt ID. Phosphosite Location is hyperlinked to PhosphoNET predictions.
Based on in vitro and/or in vivo phosphorylation data

Kinase Short Name UniProt ID (Human) Phosphosite Location Phosphosite Sequence Effect of Phosphorylation
TAO1 Q7L7X3 T215 TVGNKLDTFCGSPPY +
LKB1 Q15831 T215 TVGNKLDTFCGSPPY +
GSK3B P49841 S219 KLDTFCGSPPYAAPE -
PKCz Q05513 T613 RGSSSRSTFHGEQLR -
 

Known Downstream Substrates

For further details on these substrates click on the Substrate Short Name or UniProt ID. Phosphosite Location is hyperlinked to PhosphoNET predictions.
Based on in vitro and/or in vivo phosphorylation data

Substrate Short Name UniProt ID (Human) Phosphosite Location Phosphosite Sequence Effect of Phosphorylation
Doublecortin (DCX) O43602 S128 TRTLQALSNEKKAKK
Tau iso8 P10636-8 S262 NVKSKIGSTENLKHQ
Tau iso8 P10636-8 S293 NVQSKCGSKDNIKHV
Tau iso8 P10636-8 S305 KHVPGGGSVQIVYKP
Tau iso8 P10636-8 S324 KVTSKCGSLGNIHHK
Tau iso8 P10636-8 S356 RVQSKIGSLDNITHV
 

Protein Kinase Specificity

Matrix of observed frequency (%) of amino acids in aligned protein substrate phosphosites

Kinections GIF
Matrix Type:
Experimentally derived from alignment of 10 known protein substrate phosphosites and 33 peptides phosphorylated by recombinant MARK1 in vitro tested in-house by Kinexus.
Domain #:
1
 

Inhibitors

For further details on these inhibitors click on the Compound Name and enter it into DrugKiNET or click on the ID's
Based on in vitro and/or in vivo phosphorylation data
Compound Name KD, Ki or IC50 (nM) PubChem ID ChEMBL ID PubMed ID
Staurosporine Kd = 4 nM 5279 18183025
TTT-3002 IC50 < 4 nM
Hesperadin Kd < 10 nM 10142586 514409 19035792
Cdk1/2 Inhibitor III IC50 < 25 nM 5330812 261720 22037377
JAK3 Inhibitor VI IC50 < 25 nM 16760524 22037377
K-252a; Nocardiopsis sp. IC50 < 25 nM 3813 281948 22037377
NVP-TAE684 Kd = 31 nM 16038120 509032 22037378
BX795 IC50 < 40 nM 10077147 577784
MRT67307 IC50 < 40 nM 44464263
SB218078 IC50 > 50 nM 447446 289422 22037377
Lestaurtinib Kd = 83 nM 126565 22037378
AT9283 IC50 > 100 nM 24905142 19143567
Novartis 12a (PKD1) IC50 = 100 nM
Staurosporine aglycone IC50 < 100 nM 3035817 281948
Wyeth PDK1 Inhibitor Compound 1 IC50 = 100 nM
Gö6976 IC50 > 150 nM 3501 302449 22037377
PKR Inhibitor IC50 > 150 nM 6490494 235641 22037377
SU11652 IC50 > 150 nM 24906267 13485 22037377
N-Benzoylstaurosporine Kd = 170 nM 56603681 608533 18183025
AG-E-60384 IC50 > 250 nM 6419741 413188 22037377
ALX-270-403-M001 IC50 > 250 nM 22037377
BCP9000906 IC50 > 250 nM 5494425 21156 22037377
Dovitinib IC50 > 250 nM 57336746 22037377
Sunitinib IC50 > 250 nM 5329102 535 22037377
Syk Inhibitor IC50 > 250 nM 6419747 104279 22037377
KW2449 Kd = 310 nM 11427553 22037378
SU6656 IC50 = 500 nM 5353978 605003 22037377
SU9516 IC50 = 500 nM 5289419 258805 22037377
JNJ-7706621 Kd = 620 nM 5330790 191003 18183025
TG101348 Kd = 700 nM 16722836 1287853 22037378
Momelotinib IC50 < 750 nM 25062766 19295546
Amgen TBK 1 inhibitor (Compound II) IC50 < 800 nM
IKK-3 inhibitor IX IC50 < 800 nM 11626927 373751
Quercetagetin IC50 < 800 nM 5281680 413552
GSK-3 Inhibitor IX IC50 > 900 nM 5287844 409450
GSK650394A IC50 > 900 nM 25022668 558642
1;9-Pyrazoloanthrone IC50 > 1 µM 8515 7064 22037377
A 443654 IC50 < 1 µM 10172943 379300 19465931
Alsterpaullone IC50 > 1 µM 5005498 50894 22037377
Alsterpaullone; 2-Cyanoethyl IC50 > 1 µM 16760286 260138 22037377
Aurora A Inhibitor 23 (DF) Kd = 1 µM 21992004
BML-275 IC50 > 1 µM 11524144 478629 22037377
Flt-3 Inhibitor II IC50 > 1 µM 11601743 377193 22037377
HG-9-91-01 IC50 = 1 µM
IDR E804 IC50 > 1 µM 6419764 1802727 22037377
K00596a IC50 = 1 µM 9549298 200027
LDN193189 IC50 = 1 µM 25195294 513147
MK5108 IC50 > 1 µM 24748204 20053775
PP242 IC50 = 1 µM 25243800
R406 IC50 = 1 µM 11984591
Ruxolitinib IC50 = 1 µM 25126798 1789941
Silmitasertib IC50 > 1 µM 24748573 21174434
SNS314 IC50 > 1 µM 16047143 514582 18678489
SU11274 IC50 > 1 µM 9549297 261641 22037377
VEGFR2 Kinase Inhibitor II IC50 > 1 µM 5329155 88606 22037377
WZ3146 Kd > 1 µM 44607360 20033049
WZ4002 Kd > 1 µM 44607530 20033049
Nintedanib Kd = 1.4 µM 9809715 502835 22037378
SU14813 Kd = 1.5 µM 10138259 1721885 18183025
IPA-3 IC50 < 3 µM 521106 472940
KIN 112 IC50 > 3 µM
Tofacitinib IC50 > 3 µM 9926791 221959
SureCN4875304 IC50 > 3.5 µM 46871765 20472445
BMS-690514 Kd < 4 µM 11349170 21531814
JNJ-28871063 IC50 > 4 µM 17747413 17975007
Pelitinib Kd = 4 µM 6445562 607707 18183025
Akt Inhibitor VIII IC50 > 4.5 µM 10196499 258844
JNKIN7 IC50 > 4.5 µM 57340685
Purvalanol B IC50 > 4.5 µM 448991 23254
Syk Inhibitor II IC50 > 4.5 µM 16760670
Syk Inhibitor IV IC50 > 4.5 µM 10200390
CHEMBL1240703 Kd = 4.9 µM 52945601 1240703 19654408
Tozasertib Kd = 4.9 µM 5494449 572878 18183025
 

Disease Linkage

Comments:
Several SNPs in the MARK1 gene have been identified from genotyping of 276 families with autism. Overexpression of MARK1 in mouse cortical neurons resulted in shorter dendrite length and decreased transport speed. It has been proposed that MARK1 overexpression in autistic individuals may underlie subtle changes in synaptic plasticity linked to dendritic trafficking. MARK1 is over-expressed in the prefrontal cortex of autism patients and affects the function of cortical dendrites.
 
Gene Expression in Cancers:

TranscriptoNET (www.transcriptonet.ca) analysis with mRNA expression data retrieved from the National Center for Biotechnology Information's Gene Expression Omnibus (GEO) database, which was normalized against 60 abundantly and commonly found proteins, indicated altered expression for this protein kinase as shown here as the percent change from normal tissue controls (%CFC) as supported with the Student T-test in the following types of human cancers: Barrett's esophagus epithelial metaplasia (%CFC= -51, p<0.01); Bladder carcinomas (%CFC= +126, p<0.014); Breast epithelial carcinomas (%CFC= +137, p<0.063); Oral squamous cell carcinomas (OSCC) (%CFC= +50, p<0.068); and Skin squamous cell carcinomas (%CFC= +91, p<0.046). The COSMIC website notes an up-regulated expression score for MARK1 in diverse human cancers of 590, which is 1.3-fold of the average score of 462 for the human protein kinases. The down-regulated expression score of 12 for this protein kinase in human cancers was 0.2-fold of the average score of 60 for the human protein kinases.
Mutagenesis Experiments:

Insertional mutagenesis studies in mice have not yet revealed a role for this protein kinase in mouse cancer oncogenesis.
Mutation Rate in All Cancers:

Percent mutation rates per 100 amino acids length in human cancers: 0.12 % in 24766 diverse cancer specimens. This rate is a modest 1.57-fold higher than the average rate of 0.075 % calculated for human protein kinases in general.
Mutation Rate in Specific Cancers:

Highest percent mutation rates per 100 amino acids length in human cancers: 0.6 % in 1270 large intestine cancers tested; 0.41 % in 864 skin cancers tested; 0.4 % in 603 endometrium cancers tested; 0.28 % in 1634 lung cancers tested; 0.26 % in 629 stomach cancers tested; 0.21 % in 238 bone cancers tested; 0.18 % in 548 urinary tract cancers tested; 0.18 % in 273 cervix cancers tested; 0.11 % in 1459 pancreas cancers tested; 0.08 % in 1512 liver cancers tested; 0.08 % in 1316 breast cancers tested; 0.08 % in 1276 kidney cancers tested; 0.06 % in 833 ovary cancers tested; 0.05 % in 710 oesophagus cancers tested; 0.04 % in 942 upper aerodigestive tract cancers tested; 0.04 % in 2082 central nervous system cancers tested.
Frequency of Mutated Sites:

Most frequent mutations with the number of reports indicated in brackets: N355S (2); N355D (2); N355T (1).
Comments:
Only 1 deletion, 2 insertions and 1 complex mutations are noted on the COSMIC website.
 
COSMIC Entry:
MARK1
OMIM Entry:
606511
  • Home
  • Top of Page
Copyright 2019 Kinexus BioInformatics Corporation