
Nomenclature
Short Name:
MARK3
Full Name:
MAP-microtubule affinity-regulating kinase 3
Alias:
- Cdc25C- associated protein kinase 1
- Cdc25C-associated protein kinase 1
- PAR1A
- Protein kinase STK10
- Ser/Thr protein kinase PAR-1
- Serine/threonine-protein kinase p78
- CTAK1
- C-TAK1
- ELKL motif kinase 2
- KP78
Classification
Type:
Protein-serine/threonine kinase
Group:
CAMK
Family:
CAMKL
SubFamily:
MARK

Specific Links
Structure
Mol. Mass (Da):
87005
# Amino Acids:
776
# mRNA Isoforms:
7
mRNA Isoforms:
85,441 Da (760 AA; P27448-7); 84,489 Da (753 AA; P27448); 84,015 Da (752 AA; P27448-2); 83,308 Da (744 AA; P27448-4); 81,499 Da (729 AA; P27448-3); 79,936 Da (713 AA; P27448-6); 74,151 Da (659 AA; P27448-8)
4D Structure:
NA
1D Structure:
3D Image (rendered using PV Viewer):
PDB ID
Subfamily Alignment
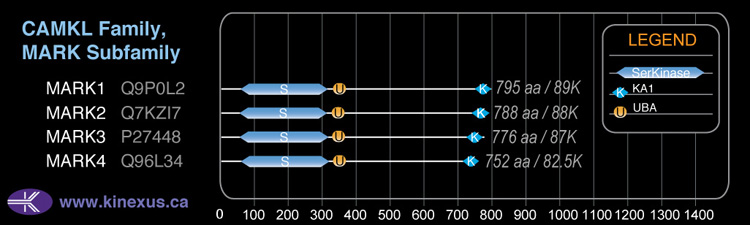
Domain Distribution:
Kinexus Products
Click on entries below for direct links to relevant products from Kinexus for this protein kinase.
hiddentext
Post-translation Modifications
For detailed information on phosphorylation of this kinase go to PhosphoNET
Ubiquitinated:
K294, K330, K741.
Serine phosphorylated:
S42, S96-, S215+, S238-, S341, S374, S376, S377, S378, S379, S380, S383, S396, S400, S419, S455, S458, S469, S476, S489, S490, S494, S499, S511, S513, S540, S543, S545, S546, S583, S585, S587, S594, S598, S601, S606, S618, S629, S643, S657, S745-.
Threonine phosphorylated:
T3, T61-, T90-, T95-, T211+, T234+, T397, T438, T491, T503, T507, T536, T541, T549, T564, T574, T576, T587, T591, T625.
Tyrosine phosphorylated:
Y241-, Y340, Y418, Y432, Y508, Y577, Y690.
Distribution
Based on gene microarray analysis from the NCBI
Human Tissue Distribution
% Max Expression:
Mean Expression:
Number of Samples:
Standard Deviation:
% Max Expression:
Mean Expression:
Number of Samples:
Standard Deviation:
 45
45
1104
35
977
 7
7
160
16
109
 10
10
254
17
163
 15
15
363
140
622
 34
34
821
34
646
 31
31
750
97
2328
 10
10
243
41
507
 36
36
889
61
1775
 29
29
709
17
474
 5
5
127
118
170
 6
6
147
41
151
 26
26
623
190
623
 5
5
123
39
111
 7
7
180
12
145
 8
8
199
36
187
 5
5
114
20
68
 20
20
492
197
3464
 11
11
261
26
217
 8
8
205
110
259
 31
31
745
137
670
 9
9
223
34
185
 10
10
251
38
255
 15
15
370
27
340
 14
14
342
26
267
 12
12
290
34
276
 39
39
955
92
1432
 9
9
226
42
233
 8
8
191
26
144
 13
13
318
26
266
 36
36
888
42
1159
 29
29
705
24
581
 100
100
2441
41
5051
 9
9
220
80
321
 34
34
820
83
710
 14
14
341
48
428
Evolution
Species Conservation
PhosphoNET % Identity:
PhosphoNET % Similarity:
Homologene %
Identity:
PhosphoNET % Identity:
PhosphoNET % Similarity:
Homologene %
Identity:
 100
100
100
100 94.7
94.7
94.7
100 -
-
-
96 -
-
-
97 -
-
-
- 96.4
96.4
97.4
97 -
-
-
- 94.1
94.1
95.1
97 90
90
91.2
95 -
-
-
- 90.6
90.6
92.9
- 31.4
31.4
50.8
96 85.7
85.7
89.6
93 26.5
26.5
42.6
88 -
-
-
- -
-
-
61 -
-
-
- 39.9
39.9
51.1
64 -
-
-
- -
-
-
- -
-
-
- -
-
-
- 27.1
27.1
44.1
- 27.3
27.3
45.9
- -
-
-
-
For a wider analysis go to PhosphoNET Evolution in PhosphoNET
Binding Proteins
Examples of known interacting proteins
hiddentext
| No. | Name – UniProt ID |
|---|---|
| 1 | PRKCQ - Q04759 |
| 2 | RASGRF1 - Q13972 |
| 3 | PKP2 - Q99959 |
| 4 | CDC25C - P30307 |
| 5 | YWHAZ - P63104 |
| 6 | DYNLL1 - P63167 |
| 7 | NUAK1 - O60285 |
| 8 | YWHAE - P62258 |
| 9 | YWHAG - P61981 |
| 10 | YWHAH - Q04917 |
Regulation
Activation:
Phosphorylation of Thr-234 and Ser-238 increases phosphotransferase activity.
Inhibition:
Phosphorylation of Thr-95 and Ser-96 inhibits phosphotransferase activity.
Synthesis:
NA
Degradation:
NA
Known Upstream Kinases
For further details on these substrates click on the Substrate Short Name or UniProt ID. Phosphosite Location is hyperlinked to PhosphoNET
predictions.
Based on in vitro and/or in vivo phosphorylation data
| Kinase Short Name | UniProt ID (Human) | Phosphosite Location | Phosphosite Sequence | Effect of Phosphorylation |
|---|
| PIM1 | P11309 | T90 | AIKIIDKTQLNPTSL | - |
| PIM1 | P11309 | T95 | DKTQLNPTSLQKLFR | - |
| PIM1 | P11309 | S96 | KTQLNPTSLQKLFRE | - |
| LKB1 | Q15831 | T234 | TVGGKLDTFCGSPPY | + |
| LKB1 | Q15831 | S238 | KLDTFCGSPPYAAPE | - |
| PKCi | P41743 | T587 | RGTASRSTFHGQPRE | |
| PKCz | Q05513 | T587 | RGTASRSTFHGQPRE | |
| MARK3 | P27448 | S606 | RGSTNLFSKLTSKLT | |
| MARK3 | P27448 | T625 | QTRSRGSTNLFSKLT | |
| MARK3 | P27448 | S629 | RGSTNLFSKLTSKLT |
Known Downstream Substrates
For further details on these substrates click on the Substrate Short Name or UniProt ID. Phosphosite Location is hyperlinked to PhosphoNET
predictions.
Based on in vitro and/or in vivo phosphorylation data
| Substrate Short Name | UniProt ID (Human) | Phosphosite Location | Phosphosite Sequence | Effect of Phosphorylation |
|---|
| MITF | O75030 | S280 | PGLTISNSCPANLPN | |
| TORC2 | Q53ET0 | S274 | PAMNTGGSLPDLTNL | |
| Cdc25C | P30307 | S216 | SGLYRSPSMPENLNR | - |
| HDAC7 | Q8WUI4 | S155 | FPLRKTVSEPNLKLR | - |
| Ksr1 (KSR) | Q8IVT5 | S309 | PTLTRSKSHESQLGN | |
| Ksr1 (KSR) | Q8IVT5 | S404 | TRLRRTESVPSDINN | |
| MARK3 | P27448 | S606 | RGSTNLFSKLTSKLT | |
| MARK3 | P27448 | S629 | RGSTNLFSKLTSKLT | |
| MARK3 | P27448 | T625 | QTRSRGSTNLFSKLT |
Protein Kinase Specificity
Matrix of observed frequency (%) of amino acids in aligned protein substrate phosphosites
Matrix Type:
Predicted from the application of the Kinexus Kinase Substrate Predictor Version 2.0 algorithm, which was trained with over 10,000 kinase-protein substrate pairs and 8,000 kinase-peptide substrate pairs.
Domain #:
1
Inhibitors
For further details on these inhibitors click on the Compound Name and enter it into DrugKiNET or click on the ID's
Based on in vitro and/or in vivo phosphorylation data
| Compound Name | KD, Ki or IC50 (nM) | PubChem ID | ChEMBL ID | PubMed ID |
|---|
Disease Linkage
Comments:
Variation in MARK3 may be involved in Alzheimer's disease.
Gene Expression in Cancers:
TranscriptoNET (www.transcriptonet.ca) analysis with mRNA expression data retrieved from the National Center for Biotechnology Information's Gene Expression Omnibus (GEO) database, which was normalized against 60 abundantly and commonly found proteins, indicated altered expression for this protein kinase as shown here as the percent change from normal tissue controls (%CFC) as supported with the Student T-test in the following types of human cancers: Bladder carcinomas (%CFC= +86, p<0.0001); Clear cell renal cell carcinomas (cRCC) stage I (%CFC= -72, p<0.0001); Clear cell renal cell carcinomas (cRCC) stage I (%CFC= -72, p<0.0001); Malignant pleural mesotheliomas (MPM) tumours (%CFC= +60, p<0.004); Prostate cancer - metastatic (%CFC= +45, p<0.0001); Skin squamous cell carcinomas (%CFC= +108, p<0.004); Uterine leiomyomas (%CFC= +313, p<0.004); and Uterine leiomyosarcomas (%CFC= +200, p<0.026). The COSMIC website notes an up-regulated expression score for MARK3 in diverse human cancers of 636, which is 1.4-fold of the average score of 462 for the human protein kinases. The down-regulated expression score of 423 for this protein kinase in human cancers was 7.1-fold of the average score of 60 for the human protein kinases.
Mutagenesis Experiments:
Insertional mutagenesis studies in mice have not yet revealed a role for this protein kinase in mouse cancer oncogenesis. A T211A substitution in MARK3 can reduce phosphorylation and activation by LKB1.
Mutation Rate in All Cancers:
Percent mutation rates per 100 amino acids length in human cancers: 0.05 % in 24751 diverse cancer specimens. This rate is only -28 % lower than the average rate of 0.075 % calculated for human protein kinases in general.
Mutation Rate in Specific Cancers:
Highest percent mutation rates per 100 amino acids length in human cancers: 0.32 % in 603 endometrium cancers tested; 0.25 % in 1270 large intestine cancers tested; 0.22 % in 589 stomach cancers tested; 0.19 % in 864 skin cancers tested; 0.13 % in 710 oesophagus cancers tested; 0.08 % in 1634 lung cancers tested; 0.05 % in 273 cervix cancers tested; 0.03 % in 833 ovary cancers tested; 0.03 % in 441 autonomic ganglia cancers tested; 0.03 % in 1512 liver cancers tested; 0.03 % in 1459 pancreas cancers tested; 0.02 % in 548 urinary tract cancers tested; 0.02 % in 2082 central nervous system cancers tested; 0.02 % in 1316 breast cancers tested; 0.02 % in 1276 kidney cancers tested; 0.01 % in 958 upper aerodigestive tract cancers tested; 0.01 % in 881 prostate cancers tested.
Frequency of Mutated Sites:
Most frequent mutations with the number of reports indicated in brackets: E120K (8).
Comments:
Only 7 deletion, 2 insertions and no complex mutations are noted on the COSMIC website.