
Nomenclature
Short Name:
MST1
Full Name:
Serine-threonine-protein kinase 4
Alias:
- EC 2.7.11.1
- Kinase MST1
- MST-1
- Serine,threonine protein kinase 4
- STK4
- YSK3; DKFZp686A2068
- Kinase responsive to stress 2
- KRS2
- Krs-2
- Mammalian sterile 20-like 1
Classification
Type:
Protein-serine/threonine kinase
Group:
STE
Family:
STE20
SubFamily:
MST

Specific Links
Structure
Mol. Mass (Da):
55,630
# Amino Acids:
487
# mRNA Isoforms:
2
mRNA Isoforms:
55,630 Da (487 AA; Q13043); 52,335 Da (462 AA; Q13043-2)
4D Structure:
Homodimer; mediated via the coiled-coil region. Interacts with NORE1, which inhibits autoactivation. Interacts with and stabilizes SAV1. Interacts with RASSF1, which leads to enzyme activation. Interacts with FOXO3
1D Structure:
3D Image (rendered using PV Viewer):
PDB ID
Subfamily Alignment
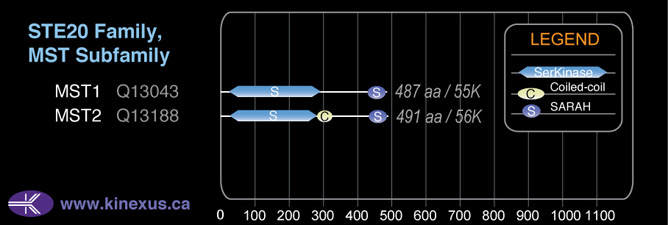
Domain Distribution:
Kinexus Products
Click on entries below for direct links to relevant products from Kinexus for this protein kinase.
hiddentext
Post-translation Modifications
For detailed information on phosphorylation of this kinase go to PhosphoNET
Acetylated:
K35.
Serine phosphorylated:
S40-, S43, S82+, S132, S265, S307, S320, S327, S394, S410, S414, S422, S423, S438.
Threonine phosphorylated:
T3, T120-, T175+, T177+, T183+, T238, T243, T329, T340, T360, T367, T380, T387-, T440.
Tyrosine phosphorylated:
Y41-, Y45, Y398, Y433.
Ubiquitinated:
K119, K151, K164, K180.
Distribution
Based on gene microarray analysis from the NCBI
Human Tissue Distribution
% Max Expression:
Mean Expression:
Number of Samples:
Standard Deviation:
% Max Expression:
Mean Expression:
Number of Samples:
Standard Deviation:
 30
30
1420
62
1046
 1.1
1.1
52
23
66
 19
19
884
12
616
 9
9
418
243
1071
 14
14
645
74
542
 4
4
174
127
573
 2
2
89
84
178
 100
100
4772
73
7124
 7
7
334
20
334
 3
3
145
191
230
 6
6
288
44
534
 14
14
679
205
702
 29
29
1373
34
2433
 0.9
0.9
42
15
32
 4
4
214
38
355
 1
1
49
39
71
 7
7
332
350
2731
 19
19
888
23
1833
 2
2
84
162
129
 13
13
613
247
532
 6
6
300
35
470
 18
18
862
39
1426
 14
14
665
22
886
 9
9
441
23
559
 16
16
758
36
1123
 39
39
1884
164
3406
 13
13
634
40
1152
 10
10
455
24
687
 10
10
455
24
631
 3
3
156
84
203
 25
25
1204
24
1108
 9
9
448
61
886
 7
7
346
170
632
 19
19
918
187
743
 5
5
217
100
221
Evolution
Species Conservation
PhosphoNET % Identity:
PhosphoNET % Similarity:
Homologene %
Identity:
PhosphoNET % Identity:
PhosphoNET % Similarity:
Homologene %
Identity:
 100
100
100
100 95.6
95.6
95.8
100 99.4
99.4
99.8
99 -
-
-
97 -
-
-
- 97.3
97.3
99
97 -
-
-
- 97.3
97.3
98.6
97 78
78
89.6
96 -
-
-
- 55.9
55.9
57.3
- 92.2
92.2
96.5
92 76.6
76.6
86.9
77 77
77
87.4
- -
-
-
- 45.4
45.4
58.6
- 62.4
62.4
77.8
- 52.3
52.3
68.4
61 65
65
79.1
- -
-
-
- -
-
-
- -
-
-
- -
-
-
- -
-
-
- -
-
-
-
For a wider analysis go to PhosphoNET Evolution in PhosphoNET
Binding Proteins
Examples of known interacting proteins
hiddentext
| No. | Name – UniProt ID |
|---|---|
| 1 | AKT1 - P31749 |
| 2 | CASP3 - P42574 |
| 3 | SAV1 - Q9H4B6 |
| 4 | CSN1S1 - P47710 |
| 5 | LATS1 - O95835 |
| 6 | PRKRIR - O43422 |
| 7 | TP53 - P04637 |
Regulation
Activation:
Activated by caspase-cleavage. Full activation requires homodimerization and autophosphorylation of Thr-183.
Inhibition:
Inhibited by the C-terminal non-catalytic region.
Synthesis:
NA
Degradation:
NA
Known Upstream Kinases
For further details on these substrates click on the Substrate Short Name or UniProt ID. Phosphosite Location is hyperlinked to PhosphoNET
predictions.
Based on in vitro and/or in vivo phosphorylation data
| Kinase Short Name | UniProt ID (Human) | Phosphosite Location | Phosphosite Sequence | Effect of Phosphorylation |
|---|
Known Downstream Substrates
For further details on these substrates click on the Substrate Short Name or UniProt ID. Phosphosite Location is hyperlinked to PhosphoNET
predictions.
Based on in vitro and/or in vivo phosphorylation data
| Substrate Short Name | UniProt ID (Human) | Phosphosite Location | Phosphosite Sequence | Effect of Phosphorylation |
|---|
| Abl1 | P00519 | T735 | DTEWRSVTLPRDLQS | + |
| Abl1 iso2 | P00519-2 | T754 | DTEWRSVTLPRDLQS | + |
| AR | P10275 | S650 | GEASSTTSPTEETTQ | - |
| FOXO1 (FOXO1A) | Q12778 | S212 | SSAGWKNSIRHNLSL | |
| FOXO3 (FKHRL1) | O43524 | S209 | SSAGWKNSIRHNLSL | + |
| FOXO3 (FKHRL1) | O43524 | S215 | NSIRHNLSLHSRFMR | + |
| FOXO3 (FKHRL1) | O43524 | S231 | QNEGTGKSSWWIINP | + |
| FOXO3 (FKHRL1) | O43524 | S232 | NEGTGKSSWWIINPD | |
| FOXO3 (FKHRL1) | O43524 | S243 | INPDGGKSGKAPRRR | + |
| H2B | P33778 | S15 | APAPKKGSKKAITKA | |
| MOBKL1A (MOB1B) | Q7L9L4 | T12 | FGSRSSKTFKPKKNI | + |
| MOBKL1A (MOB1B) | Q7L9L4 | T35 | LLKHAEATLGSGNLR | + |
| MST1 (STK4) | Q13043 | S327 | SEEDEMDSGTMVRAV | |
| MST1 (STK4) | Q13043 | T177 | VAGQLTDTMAKRNTV | + |
| MST1 (STK4) | Q13043 | T183 | DTMAKRNTVIGTPFW | + |
| MST1 (STK4) | Q13043 | T387 | TMKRRDETMQPAKPS | + |
| TNNI3 | P19429 | T128 | ITEIADLTQKIFDLR | |
| TNNI3 | P19429 | T142 | RGKFKRPTLRRVRIS | |
| TNNI3 | P19429 | T30 | SNYRAYATEPHAKKK | |
| TNNI3 | P19429 | T50 | SRKLQLKTLLLQIAK |
Protein Kinase Specificity
Matrix of observed frequency (%) of amino acids in aligned protein substrate phosphosites
Matrix Type:
Experimentally derived from alignment of 26 known protein substrate phosphosites and 9 peptides phosphorylated by recombinant MST1 in vitro tested in-house by Kinexus.
Domain #:
1
Inhibitors
For further details on these inhibitors click on the Compound Name and enter it into DrugKiNET or click on the ID's
Based on in vitro and/or in vivo phosphorylation data
| Compound Name | KD, Ki or IC50 (nM) | PubChem ID | ChEMBL ID | PubMed ID |
|---|
Disease Linkage
General Disease Association:
Cancer, inflammatory, and immune disorders
Specific Diseases (Non-cancerous):
Primary sclerosing cholangitis (PSC); Sclerosing cholangitis; T-cell immunodeficiency, Recurrent infections, autoimmunity, and cardiac malformations
Comments:
Primary Sclerosing Cholangitis (PSC) is a gastrointestinal disease where the bile ducts are inflamed and partially obstructed leading to accumulation of bile in the liver. PSC will lead to liver cirrhosis and failure over time. Sclerosing Cholangitis is related to Primary Sclerosing Cholangitis and can affect the liver, colon, and T cells. The rare immune disorder, T-Cell Immunodeficiency, Recurrent Infections, Autoimmunity, and Cardiac Malformations, which has also been called Combined Immunodeficiency due to stk4 deficiency is characterized by recurring viral, bacterial, or fungal infections, loss of naive T cells, abscesses, warts, autoimmunity, and cardiac dysfunctions. MST1 kinase phosphotransferase activity can be lost with either a K59R or a T183A mutation. Proteolytic cleavage of MST1 during apoptosis can be reduced with the D326N and D349N mutations.
Specific Cancer Types:
Pancreatic cancer; Merkel cell carcinomas
Comments:
MST1 is linked to pancreatic cancer, which is a rare cancer that does not have characteristic symptoms but is related to the integrated breast cancer and pancreatic cancer pathways.
Gene Expression in Cancers:
TranscriptoNET (www.transcriptonet.ca) analysis with mRNA expression data retrieved from the National Center for Biotechnology Information's Gene Expression Omnibus (GEO) database, which was normalized against 60 abundantly and commonly found proteins, indicated altered expression for this protein kinase as shown here as the percent change from normal tissue controls (%CFC) as supported with the Student T-test in the following types of human cancers: Brain oligodendrogliomas (%CFC= -54, p<0.038); Breast epithelial carcinomas (%CFC= +98, p<0.082); and Clear cell renal cell carcinomas (cRCC) stage I (%CFC= +1050, p<0.0006). The COSMIC website notes an up-regulated expression score for MST1 in diverse human cancers of 676, which is 1.5-fold of the average score of 462 for the human protein kinases. The down-regulated expression score of 49 for this protein kinase in human cancers was 0.8-fold of the average score of 60 for the human protein kinases.
Mutagenesis Experiments:
Insertional mutagenesis studies in mice have not yet revealed a role for this protein kinase in mouse cancer oncogenesis. MST1 phosphotransferase activity can be lost with either a K59R or a T183A mutation. Proteolytic cleavage of MST1 during apoptosis can be reduced with the D326N and D349N mutations. Homodimerization and autophosphorylation can be lost with a L444P mutation.
Mutation Rate in All Cancers:
Percent mutation rates per 100 amino acids length in human cancers: 0.05 % in 25159 diverse cancer specimens. This rate is only -27 % lower than the average rate of 0.075 % calculated for human protein kinases in general.
Mutation Rate in Specific Cancers:
Highest percent mutation rates per 100 amino acids length in human cancers: 0.34 % in 602 endometrium cancers tested; 0.28 % in 1093 large intestine cancers tested.
Frequency of Mutated Sites:
None > 6 in 19,967 cancer specimens
Comments:
No deletions, insertions or complex mutations are noted on the COSMIC website.