
Nomenclature
Short Name:
CASK
Full Name:
Peripheral plasma membrane protein CASK
Alias:
- CAGH39
- Calcium/calmodulin-dependent serine protein kinase
- Lin-2
- Lin-2 homolog
- TNRC8
- CSKP
- EC 2.7.11.1
- Kinase CASK
- LIN2
Classification
Type:
Protein-serine/threonine kinase
Group:
CAMK
Family:
CASK
SubFamily:
NA

Structure
Mol. Mass (Da):
105123
# Amino Acids:
926
# mRNA Isoforms:
6
mRNA Isoforms:
105,123 Da (926 AA; O14936); 104,520 Da (921 AA; O14936-2); 103,211 Da (909 AA; O14936-6); 102,165 Da (898 AA; O14936-4); 102,114 Da (897 AA; O14936-3); 59,393 Da (518 AA; O14936-5)
4D Structure:
Binds WHRN and NRXN1 cytosolic tail. Interacts with CASKIN1, APBA1, LIN7(A/B/C) and L27 domain of DLG1 and isoform 2 of DLG4. CASK and LIN7 form two mutually exclusive tripartite complexes with APBA1 or CASKIN1 . Interacts with FCHSD2. Interacts with TSPYL2. Part of a complex containing CASK, TRB1 and TSPYL2. Interacts with KIRREL3.
1D Structure:
3D Image (rendered using PV Viewer):
PDB ID
Subfamily Alignment
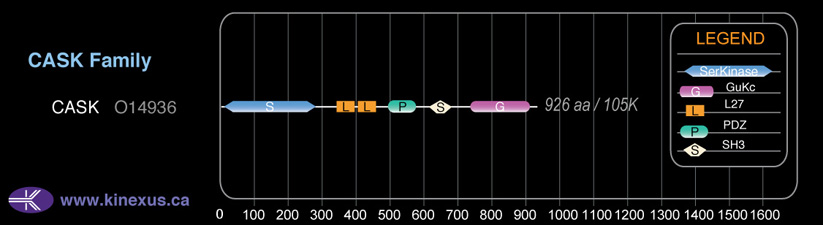
Domain Distribution:
Post-translation Modifications
For detailed information on phosphorylation of this kinase go to PhosphoNET
Serine phosphorylated:
S50, S51-, S151, S155-, S313, S314, S353, S395-, S465-, S562, S570, S582, S600, S792+ .
Threonine phosphorylated:
T182+, T460, T573, T741, T775.
Tyrosine phosphorylated:
Y282, Y387, Y571, Y708, Y712, Y769, Y788, Y789.
Ubiquitinated:
K60, K665, K825.
Distribution
Based on gene microarray analysis from the NCBI
Human Tissue Distribution
% Max Expression:
Mean Expression:
Number of Samples:
Standard Deviation:
% Max Expression:
Mean Expression:
Number of Samples:
Standard Deviation:
 66
66
1442
50
1549
 3
3
64
22
84
 6
6
137
24
93
 16
16
346
190
654
 36
36
796
54
594
 6
6
129
106
134
 16
16
361
73
508
 48
48
1054
71
1939
 32
32
705
17
610
 4
4
83
185
89
 3
3
65
51
64
 24
24
522
260
621
 5
5
120
46
91
 2
2
51
19
64
 5
5
103
46
77
 3
3
62
31
55
 3
3
64
477
590
 22
22
475
36
1940
 3
3
57
171
61
 29
29
629
193
564
 9
9
193
45
193
 6
6
121
49
116
 9
9
202
26
139
 2
2
45
36
54
 4
4
96
45
92
 49
49
1077
131
2047
 5
5
109
49
91
 12
12
260
36
810
 6
6
133
35
120
 3
3
68
70
60
 33
33
715
24
641
 100
100
2191
51
4966
 11
11
239
127
503
 34
34
748
130
645
 3
3
65
74
56
Evolution
Species Conservation
PhosphoNET % Identity:
PhosphoNET % Similarity:
Homologene %
Identity:
PhosphoNET % Identity:
PhosphoNET % Similarity:
Homologene %
Identity:
 100
100
100
100 0
0
0
100 73.2
73.2
73.2
100 -
-
-
100 -
-
-
94 99.8
99.8
99.8
100 -
-
-
- 99.8
99.8
100
100 97.7
97.7
97.9
100 -
-
-
- 94.5
94.5
95.5
- 33
33
42.7
99.5 25.5
25.5
36
99 93.5
93.5
96.2
94 32.7
32.7
42
- 62
62
77
64 66.4
66.4
78.6
- 42.9
42.9
62.1
53 -
-
-
- -
-
-
- -
-
-
- -
-
-
- -
-
-
- -
-
-
- -
-
-
-
For a wider analysis go to PhosphoNET Evolution in PhosphoNET
Binding Proteins
Examples of known interacting proteins
hiddentext
| No. | Name – UniProt ID |
|---|---|
| 1 | LIN7A - O14910 |
| 2 | APBA1 - Q02410 |
| 3 | KCNJ4 - P48050 |
| 4 | SDC2 - P34741 |
| 5 | LIN7B - Q9HAP6 |
| 6 | C16orf70 - Q9BSU1 |
| 7 | DLG4 - P78352 |
| 8 | LIN7C - Q9NUP9 |
| 9 | EPS8 - Q12929 |
| 10 | FCHSD2 - O94868 |
| 11 | CNTNAP4 - Q9C0A0 |
| 12 | RAB3A - P20336 |
| 13 | TANC1 - Q9C0D5 |
| 14 | GLS2 - Q9UI32 |
| 15 | KCNJ2 - P63252 |
Regulation
Activation:
The kinase catalytic domain apparently exhibits a constitutively active conformation.
Inhibition:
Phosphorylation of Ser-51 and Ser-395 inhibits interaction with liprin alpha 1. The autoinhibitory region does not engage in direct contact with the ATP-binding cleft, although it still binds Ca2+/CAM.
Synthesis:
NA
Degradation:
NA
Known Upstream Kinases
For further details on these substrates click on the Substrate Short Name or UniProt ID. Phosphosite Location is hyperlinked to PhosphoNET
predictions.
Based on in vitro and/or in vivo phosphorylation data
| Kinase Short Name | UniProt ID (Human) | Phosphosite Location | Phosphosite Sequence | Effect of Phosphorylation |
|---|
Known Downstream Substrates
For further details on these substrates click on the Substrate Short Name or UniProt ID. Phosphosite Location is hyperlinked to PhosphoNET
predictions.
Based on in vitro and/or in vivo phosphorylation data
| Substrate Short Name | UniProt ID (Human) | Phosphosite Location | Phosphosite Sequence | Effect of Phosphorylation |
|---|
Protein Kinase Specificity
Matrix of observed frequency (%) of amino acids in aligned protein substrate phosphosites
Matrix Type:
Predicted from the application of the Kinexus Kinase Substrate Predictor Version 2.0 algorithm, which was trained with over 10,000 kinase-protein substrate pairs and 8,000 kinase-peptide substrate pairs.
Domain #:
1
Inhibitors
For further details on these inhibitors click on the Compound Name and enter it into DrugKiNET or click on the ID's
Based on in vitro and/or in vivo phosphorylation data
| Compound Name | KD, Ki or IC50 (nM) | PubChem ID | ChEMBL ID | PubMed ID |
|---|
| Staurosporine | Kd = 19 nM | 5279 | 22037378 | |
| AT7519 | Kd = 24 nM | 11338033 | 22037378 | |
| R547 | Kd = 66 nM | 6918852 | 22037378 | |
| Crizotinib | Kd = 140 nM | 11626560 | 601719 | 22037378 |
| Lestaurtinib | Kd = 330 nM | 126565 | 22037378 | |
| AC1NS7CD | Kd = 400 nM | 5329665 | 295136 | 22037378 |
| SNS032 | Kd = 400 nM | 3025986 | 296468 | 22037378 |
| Bosutinib | Kd = 830 nM | 5328940 | 288441 | 22037378 |
| NVP-TAE684 | Kd = 920 nM | 16038120 | 509032 | 22037378 |
| WZ3146 | Kd > 1 µM | 44607360 | 20033049 | |
| WZ4002 | Kd > 1 µM | 44607530 | 20033049 | |
| Ruxolitinib | Kd = 1.5 µM | 25126798 | 1789941 | 22037378 |
| PP242 | Kd = 1.6 µM | 25243800 | 22037378 | |
| PHA-665752 | Kd = 1.7 µM | 10461815 | 450786 | 22037378 |
| TG101348 | Kd = 2.8 µM | 16722836 | 1287853 | 22037378 |
Disease Linkage
General Disease Association:
Neurological disorders
Specific Diseases (Non-cancerous):
Fg syndrome 4 (FGS4); Cask-related disorders; Mental Retardation and Microcephaly with Pontine and Cerebellar Hypoplasia (MICPCH); Microcephaly; Cask-related Intellectual Disability; Cerebellar Hypoplasia; Intellectual Disability; Mental Retardation; Pontocerebellar Hypoplasia; Ohtahara syndrome; Neurogenic Bladder; Urethral Obstruction; Tethered Spinal Cord syndrome; Detrusor Sphincter Dyssynergia; Substernal Goiter; Low Compliance Bladder; Mental Retardation, with or Without Nystagmus; Epileptic Encephalopathy, Early Infantile, 17; Intellectual Disability and Microcephaly with Pontine and Cerebellar Hypoplasia
Comments:
Y268H, P396S, and D710G are loss of function mutations associated with mental retardation and microcephaly with pontine and cerebellar hypoplasia (MICPCH). MICPCH is a disease that is characterized by significantly below average general intellectual functions, progressive microcephaly with or without ophthalmologic anomalies, and sensorineural hearing loss, and occurs more frequently in females. R28L mutation is relevant to FG syndrome 4 (FGS4), which causes a partial skipping of exon 2 of the protein. X-linked intellectual disability (XLID) with or without nystagmus, is generally associated with hypomorphic CASK mutations.
Comments:
CASK levels are up-regulated 1.5-fold in human tumours compared to most other protein kinases.
Gene Expression in Cancers:
TranscriptoNET (www.transcriptonet.ca) analysis with mRNA expression data retrieved from the National Center for Biotechnology Information's Gene Expression Omnibus (GEO) database, which was normalized against 60 abundantly and commonly found proteins, indicated altered expression for this protein kinase as shown here as the percent change from normal tissue controls (%CFC) as supported with the Student T-test in the following types of human cancers: Barrett's esophagus epithelial metaplasia (%CFC= +139, p<0.044); Bladder carcinomas (%CFC= +71, p<0.002); Brain oligodendrogliomas (%CFC= -77, p<0.014); and Oral squamous cell carcinomas (OSCC) (%CFC= +69, p<0.005). The COSMIC website notes an up-regulated expression score for CASK in diverse human cancers of 700, which is 1.5-fold of the average score of 462 for the human protein kinases. The down-regulated expression score of 62 for this protein kinase in human cancers was 1-fold of the average score of 60 for the human protein kinases.
Mutagenesis Experiments:
Insertional mutagenesis studies in mice have not yet revealed a role for this protein kinase in mouse cancer oncogenesis.
Mutation Rate in All Cancers:
Percent mutation rates per 100 amino acids length in human cancers: 0.06 % in 24990 diverse cancer specimens. This rate is only -19 % lower than the average rate of 0.075 % calculated for human protein kinases in general.
Mutation Rate in Specific Cancers:
Highest percent mutation rates per 100 amino acids length in human cancers: 0.38 % in 603 endometrium cancers tested; 0.27 % in 1270 large intestine cancers tested; 0.12 % in 864 skin cancers tested; 0.2 % in 273 cervix cancers tested.
Frequency of Mutated Sites:
None > 5 in 20,273 cancer specimens
Comments:
Only 3 deletions, 1 insertion, and no complex mutations are noted on the COSMIC website.