
Nomenclature
Short Name:
TRKA
Full Name:
High affinity nerve growth factor receptor
Alias:
- DKFZp781I14186
- EC 2.7.10.1
- TRK
- TRK1
- MTC
- NTRK1
- P140-TrkA
- Slow nerve growth factor receptor
Classification
Type:
Protein-tyrosine kinase
Group:
TK
Family:
Trk
SubFamily:
NA

Specific Links
Structure
Mol. Mass (Da):
87497
# Amino Acids:
796
# mRNA Isoforms:
4
mRNA Isoforms:
87,497 Da (796 AA; P04629); 86,880 Da (790 AA; P04629-2); 83,993 Da (760 AA; P04629-3); 77,145 Da (698 AA; P04629-4)
4D Structure:
Exists in a dynamic equilibrium between monomeric (low affinity) and dimeric (high affinity) structures. Binds SH2B2. Interacts with SQSTM1 which bridges NTRK1 to NGFR. Interacts with KIDINS220 and NGFR. Can form a ternary complex with NGFR and KIDINS220
3D Structure:
1D Structure:
3D Image (rendered using PV Viewer):
PDB ID
Subfamily Alignment
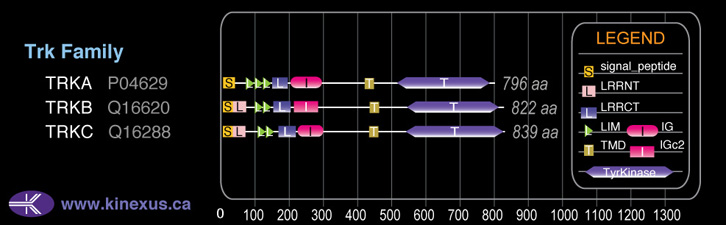
Domain Distribution:
Kinexus Products
Click on entries below for direct links to relevant products from Kinexus for this protein kinase.
hiddentext
Post-translation Modifications
For detailed information on phosphorylation of this kinase go to PhosphoNET
N-GlcNAcylated:
N67, N95, N121, N188, N202, N253, N262, N281, N318, N323, N338, N358, N401.
Serine phosphorylated:
S123, S672.
Tyrosine phosphorylated:
Y496+, Y591, Y676+, Y680+, Y681+, Y701-, Y729, Y757+, Y791+, Y490, Y670, Y674, Y675, Y751, Y785.
Ubiquitinated:
K197, K359, K503.
Distribution
Based on gene microarray analysis from the NCBI
Human Tissue Distribution
% Max Expression:
Mean Expression:
Number of Samples:
Standard Deviation:
% Max Expression:
Mean Expression:
Number of Samples:
Standard Deviation:
 32
32
522
16
1077
 0.6
0.6
10
10
8
 2
2
31
16
30
 9
9
146
58
321
 16
16
256
12
223
 0.1
0.1
2
37
2
 27
27
441
23
622
 15
15
247
32
442
 12
12
199
10
205
 8
8
131
71
205
 2
2
37
31
43
 17
17
280
131
399
 2
2
35
26
43
 0.2
0.2
3
6
2
 2
2
33
13
38
 0.4
0.4
6
8
5
 1.2
1.2
20
196
20
 2
2
33
21
35
 2
2
31
64
138
 13
13
209
56
250
 6
6
99
27
379
 2
2
26
27
26
 2
2
35
17
30
 1.1
1.1
18
23
15
 2
2
34
27
37
 12
12
200
40
328
 0.9
0.9
15
30
22
 2
2
37
23
39
 2
2
25
22
25
 2
2
34
14
16
 26
26
424
30
230
 100
100
1646
21
4742
 33
33
547
46
1342
 32
32
523
26
455
 1
1
16
22
13
Evolution
Species Conservation
PhosphoNET % Identity:
PhosphoNET % Similarity:
Homologene %
Identity:
PhosphoNET % Identity:
PhosphoNET % Similarity:
Homologene %
Identity:
 100
100
100
100 50.4
50.4
63.9
100 87.6
87.6
89.8
99 -
-
-
93 -
-
-
- 91.2
91.2
93.7
92 -
-
-
- 86.4
86.4
91
87 86
86
91
87 -
-
-
- 45.1
45.1
58.7
- 62.2
62.2
72.5
64 21.8
21.8
34.4
61 47.7
47.7
59.7
54 -
-
-
- 27.3
27.3
43.6
- -
-
-
- -
-
-
- -
-
-
- -
-
-
- -
-
-
- -
-
-
- -
-
-
- -
-
-
- -
-
-
-
For a wider analysis go to PhosphoNET Evolution in PhosphoNET
Binding Proteins
Examples of known interacting proteins
hiddentext
| No. | Name – UniProt ID |
|---|---|
| 1 | NGFR - P08138 |
| 2 | FRS2 - Q8WU20 |
| 3 | KIDINS220 - Q9ULH0 |
| 4 | DNAJA3 - Q96EY1 |
| 5 | IRS1 - P35568 |
| 6 | CRK - P46108 |
| 7 | PTPN6 - P29350 |
| 8 | MATK - P42679 |
| 9 | MAPK3 - P27361 |
| 10 | SHC2 - P98077 |
| 11 | PIK3R1 - P27986 |
| 12 | DYNLL1 - P63167 |
| 13 | NEDD4L - Q96PU5 |
| 14 | RPS27A - P62988 |
| 15 | ARHGAP32 - A7KAX9 |
Regulation
Activation:
Activated by binding of nerve growth factor (NGF), which induces dimerization and autophosphorylation. Autophosphorylation of Tyr-496 increases phosphotransferase activity and induces interaction with FRS2 and Shc1. Autophosphorylation of Tyr-757 increases phosphotransferase activity. Autophosphorylation of Tyr-791 increases phosphotransferase activity and induces interaction with PLCg1.
Inhibition:
Phosphorylation of Tyr-701 inhibits phosphotransferase activity and induces interaction with CLTC and LAMP1.
Synthesis:
NA
Degradation:
NA
Known Upstream Kinases
For further details on these substrates click on the Substrate Short Name or UniProt ID. Phosphosite Location is hyperlinked to PhosphoNET
predictions.
Based on in vitro and/or in vivo phosphorylation data
| Kinase Short Name | UniProt ID (Human) | Phosphosite Location | Phosphosite Sequence | Effect of Phosphorylation |
|---|
Known Downstream Substrates
For further details on these substrates click on the Substrate Short Name or UniProt ID. Phosphosite Location is hyperlinked to PhosphoNET
predictions.
Based on in vitro and/or in vivo phosphorylation data
| Substrate Short Name | UniProt ID (Human) | Phosphosite Location | Phosphosite Sequence | Effect of Phosphorylation |
|---|
| CDK5 | Q00535 | Y15 | EKIGEGTYGTVFKAK | - |
| CTNNB1 | P35222 | Y654 | RNEGVATYAAAVLFR | + |
| Shc3 | Q92529 | Y341 | GDGSDHPYYNSIPSK | ? |
| Shc3 | Q92529 | Y342 | DGSDHPYYNSIPSKM | ? |
| Shc3 | Q92529 | Y379 | FAGKEQTYYQGRHLG | |
| Shc3 | Q92529 | Y380 | AGKEQTYYQGRHLGD | |
| Shc3 | P29353 | Y406 | RQGSSDIYSTPEGKL | |
| Shc3 | P29353 | Y424 | PTGEAPTYVNTQQIP | |
| TrkA (NTRK1) | P04629 | Y496 | HIIENPQYFSDACVH | + |
| TrkA (NTRK1) | P04629 | Y676 | FGMSRDIYSTDYYRV | + |
| TrkA (NTRK1) | P04629 | Y680 | RDIYSTDYYRVGGRT | + |
| TrkA (NTRK1) | P04629 | Y681 | DIYSTDYYRVGGRTM | + |
| TrkA (NTRK1) | P04629 | Y791 | LAQAPPVYLDVLG__ | + |
Protein Kinase Specificity
Matrix of observed frequency (%) of amino acids in aligned protein substrate phosphosites
Matrix Type:
Experimentally derived from alignment of 15 known protein substrate phosphosites and 70 peptides phosphorylated by recombinant TrkA in vitro tested in-house by Kinexus.
Domain #:
1
Inhibitors
For further details on these inhibitors click on the Compound Name and enter it into DrugKiNET or click on the ID's
Based on in vitro and/or in vivo phosphorylation data
| Compound Name | KD, Ki or IC50 (nM) | PubChem ID | ChEMBL ID | PubMed ID |
|---|
Disease Linkage
General Disease Association:
Cancer, genetic disorders
Specific Diseases (Non-cancerous):
Congenital insensitivity to pain with anhidrosis; Anhidrosis; Autonomic neuropathy; Hereditary sensory and autonomic neuropathy Type V; Pyruvate kinase deficiency; Chagas disease; Relapsing fever; Dysautonomia
Comments:
Congenital insensitivity to pain with anhidrosis (CIPA) is a genetic disease characterized by the inability to sense pain or temperature combined with reduced (or absent) sweating (anhidrosis). Symptoms of the disease generally appear at birth or soon after and may be complicated by prolonged healing from skin or skeletal injuries, which can manifest as chronic bone infections (osteomyelitis) or Charcot joints, a condition in which the bones and tissues of joints are degraded. This disease is inherited in an autosomal dominant manner. Analysis of CIPA patients revealed 11 novel mutations in the TRKA gene including 6 missense mutations, 2 frameshift mutations, 1 nonsense mutation, and 2 mutations producing abnormal splicing of the TRKA mRNA. The observed mutations were concentrated in either the extracellular NGF-binding domain of the TRKA protein or in an intracellular domain involved in downstream signal transduction. In animal studies, mice lacking the TRKA protein displayed a phenotype that closely resembled the symptoms of CIPA, including loss of response to painful stimuli. Additionally, the administration of MNAC13, a known antibody that neutralizes TRKA function, was shown to possess analgesic properties in mouse models of acute and chronic neuropathic pain. Autonomic neuropathy is a neurological disease characterized by defects in the autonomic nervous system (ANS), which carries information from the brain and spinal cord to the heart, bladder, intestine, sweat glands, pupils, and blood vessels. This disease has numerous symptoms, ranging from postural changes to digestive abnormalities. Loss-of-function mutations in TRKA have been observed in patients with this disease, reflecting the important role of NGF-TRKA signalling in the developmenal and survival of sympathetic neurons.
Specific Cancer Types:
Granular cell tumours; Thyroid cancer; neuroblastomas; Adrenal neuroblastomas; Askin's tumours; Thyroid medullary carcinomas; Familial medullary thyroid carcinomas; Follicular thyroid carcinomas; NTRK1-related familial medullary thyroid carcinomas
Comments:
TRKA appears to be an oncoprotein (OP). Overactive forms of the TRKA protein are known to have oncogenic properties and promote tumorigenesis. Chromosomal translocations involving the TRKA gene have been observed in thyroid papillary carcinoma tissue samples. Translocation t(1;3)(q21;q11) with the TFG gene creates the TRKT3(TRK-T3) mRNA transcript by the fusing of TFG to the 3'-end of TRKA. This translocation involves the replacement of the extracellular domain of the TRKA protein with the 221 N-terminal amino acids of the TPM3 protein. Additional observed chromosomal translocations include the fusion of the TPM3 gene to the 3'-end of TRKA mRNA, and an intra-chomosomal translocation that fuses the protein kinase catalytic domain to the 5'-end of the TPR gene to form the chimeric protein TRK-T1. These translocations are hypothesized to yield fusion proteins with constitutive tyrosine kinase activity, thus they represent gain-of-function mutations and the protein is considered as a oncoprotein.
Gene Expression in Cancers:
The COSMIC website notes an up-regulated expression score for TRKA in diverse human cancers of 310, which is 0.7-fold of the average score of 462 for the human protein kinases. The down-regulated expression score of 0 for this protein kinase in human cancers was 100% lower than the average score of 60 for the human protein kinases.
Mutagenesis Experiments:
Insertional mutagenesis studies in mice have not yet revealed a role for this protein kinase in mouse cancer oncogenesis.
Mutation Rate in All Cancers:
Percent mutation rates per 100 amino acids length in human cancers: 0.12 % in 25763 diverse cancer specimens. This rate is 1.7-fold higher than the average rate of 0.075 % calculated for human protein kinases in general.
Mutation Rate in Specific Cancers:
Highest percent mutation rates per 100 amino acids length in human cancers: 0.6 % in 854 skin cancers tested; 0.5 % in 1152 large intestine cancers tested; 0.33 % in 602 endometrium cancers tested; 0.28 % in 1944 lung cancers tested; 0.26 % in 575 stomach cancers tested; 0.14 % in 904 ovary cancers tested; 0.11 % in 1314 kidney cancers tested; 0.08 % in 1488 breast cancers tested.
Frequency of Mutated Sites:
None > 5 in 20,861 cancer specimens
Comments:
Only 4 deletions, no insertions or complex mutations are noted on the COSMIC website.